Published as part of the Macroprudential Bulletin 19, October 2022.
Euro area housing market dynamics have been remarkably buoyant since the start of the COVID-19 pandemic in the first quarter of 2020. Nominal house prices and real housing investment stood at about 18% and 6%, respectively, in the first quarter of 2022, above their pre-pandemic levels. However, heightened uncertainty and tightening financing conditions have worsened the housing market outlook recently. This focus proposes a novel framework, the combined price quantity (CPQ) model, which features demand and supply long-run relationships in the housing market, to assess the status of house prices and housing investment relative to equilibrium levels.[1]
The CPQ model is based on a demand and a supply long-run equilibrium relationship. The demand equation relates nominal house prices to real disposable income (positively), real housing investment and the nominal mortgage interest rate (both negatively). The supply equation reflects a Tobin’s Q relationship to proxy investors’ profitability motives, relating real housing investment to nominal house prices (positively) and the housing investment deflator (negatively), as well as total employment (positively). The housing market is in equilibrium when house prices and housing investment are in line with their long-term determinants, or in other words, when the residual terms of both equations are zero.
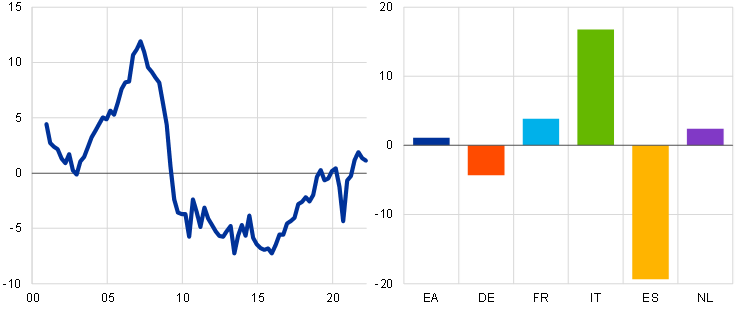
Euro area house prices are estimated to be more than 10% above their equilibrium level in the first quarter of 2022. This is similar to the figure assessed in the period before the global financial crisis (GFC) and higher than the valuation estimated using an inverted demand model – although this focuses on real house prices and thus excludes the recent surge in inflation (Chart A, panel a, left-hand side).[2] In contrast, housing investment is assessed to be close to its long-run equilibrium in the first quarter of 2022, a notable difference compared with pre-GFC levels (Chart A, panel b, right-hand side). The difference across countries stands out, with Germany and Spain exhibiting house prices above and housing investment below their long-run equilibrium levels, as opposed to France and Italy.
What are the risks and implications of this assessment from a financial stability angle? House prices could see a downward correction from above equilibrium levels, reflecting a potential further weakening in housing demand. Moreover, the continued deterioration of financing conditions could compound risks stemming from increased household indebtedness, implying additional challenges for the outlook for house prices.[3] Potential house price corrections could spread to housing investment, even though it is close to its long-run equilibrium level. However, possible shifts in housing preferences[4] – also related to teleworking patterns – and the use of accumulated savings could mitigate risks surrounding the outlook for the housing market.
Chart A
Estimates of house price and housing investment deviations from their long-run equilibrium
a) House prices
(left-hand side: estimates for euro area house prices; right-hand side: estimates for house prices in selected countries in Q1 2022; percentages)

b) Housing investment
(left-hand side: estimates for euro area housing investment; right-hand side: estimates for housing investment in selected countries in Q1 2022, percentages)

Sources: Eurosystem and ECB staff calculations (see footnotes 1 and 2).
Notes: The charts show the residuals of the demand and supply equations estimated using the CPQ model, normalised to a zero mean across the sample.
The model is a Bayesian vector error correction model, estimated between the first quarter of 1999 and the fourth quarter of 2021 for euro area aggregate and country-specific data separately.
For an overview of the ECB’s model-based valuation estimates see Box 3 of the ECB’s November 2015 Financial Stability Review and for a discussion of vulnerabilities in residential real estate see the ECB’s May 2022 Financial Stability Review. Estimates and comparisons should be treated with caution given the unobserved nature of long-run equilibrium in the housing markets. The CPQ model is estimated in nominal terms and the inverted demand model in real terms, which could explain some of the differences in estimates over time.
Indebtedness, defined as the ratio of housing loans to annual gross disposable income, stood at 97.5% in the first quarter of 2022 in the euro area, 3.2% above the level seen at the beginning of 2020, but still 2.5% below its post-GFC peak.
For a discussion on possible shifts in preferences towards housing see Focus 1 in this review and the box entitled “The impact of rising mortgage rates on the euro area housing market”, Economic Bulletin, Issue 6, ECB, 2022.


