
Economic, financial and monetary developments
Overview
At its meeting on 5 June 2025, the Governing Council decided to lower the three key ECB interest rates by 25 basis points. In particular, the decision to lower the deposit facility rate – the rate through which the Governing Council steers the monetary policy stance – was based on its updated assessment of the inflation outlook, the dynamics of underlying inflation and the strength of monetary policy transmission.
Inflation is currently at around the Governing Council’s 2% medium-term target. In the baseline of the June 2025 Eurosystem staff macroeconomic projections for the euro area, headline inflation is set to average 2.0% in 2025, 1.6% in 2026 and 2.0% in 2027. The downward revisions compared with the March 2025 ECB staff macroeconomic projections for the euro area, by 0.3 percentage points for both 2025 and 2026, mainly reflect lower assumptions for energy prices and a stronger euro. Staff expect inflation excluding energy and food to average 2.4% in 2025 and 1.9% in 2026 and 2027, broadly unchanged since March.
Staff see real GDP growth averaging 0.9% in 2025, 1.1% in 2026 and 1.3% in 2027. The unrevised growth projection for 2025 reflects a stronger than expected first quarter combined with weaker prospects for the remainder of the year. While the uncertainty surrounding trade policies is expected to weigh on business investment and exports, especially in the short term, rising government investment in defence and infrastructure will increasingly support growth over the medium term. Higher real incomes and a robust labour market will allow households to spend more. Together with more favourable financing conditions, this should make the economy more resilient to global shocks.
In the context of high uncertainty, staff also assessed some of the mechanisms by which different trade policies could affect growth and inflation under some alternative illustrative scenarios. These scenarios are published with the staff projections on the ECB’s website. Under this scenario analysis, a further escalation of trade tensions over the coming months would result in growth and inflation being below the baseline projections. By contrast, if trade tensions were resolved with a benign outcome, growth and, to a lesser extent, inflation would be higher than in the baseline projections.
Most measures of underlying inflation suggest that inflation will settle at around the Governing Council’s 2% medium-term target on a sustained basis. Wage growth is still elevated but continues to moderate visibly, and profits are partially buffering its impact on inflation. The concerns that increased uncertainty and a volatile market response to the trade tensions in April would have a tightening impact on financing conditions have eased.
The Governing Council is determined to ensure that inflation stabilises sustainably at its 2% medium-term target. Especially in current conditions of exceptional uncertainty, it will follow a data-dependent and meeting-by-meeting approach to determining the appropriate monetary policy stance. The Governing Council’s interest rate decisions will be based on its assessment of the inflation outlook in light of the incoming economic and financial data, the dynamics of underlying inflation and the strength of monetary policy transmission. The Governing Council is not pre-committing to a particular rate path.
Economic activity
The economy grew by 0.3% in the first quarter of 2025, according to Eurostat’s flash estimate. Unemployment, at 6.2% in April, is at its lowest level since the launch of the euro, and employment grew by 0.3% in the first quarter of the year, according to the flash estimate.
The outlook for euro area economic growth is clouded by trade tensions and elevated global uncertainty. For 2025 as a whole, these effects are seen to be partly compensated by stronger than expected economic activity in the first quarter, which likely reflects in part the frontloading of exports in anticipation of higher tariffs. In the medium term economic activity is seen to be supported by the recently announced new fiscal measures. The June 2025 baseline projections assume that US tariffs on EU goods, which have increased to 10%, will remain in place over the entire projection horizon. Together with the elevated trade policy uncertainty and the recent appreciation of the euro, the higher tariffs will weigh on euro area exports and investment, and, to a lesser extent, on consumption. By contrast, new government spending on infrastructure and defence, mainly in Germany, should bolster euro area domestic demand from 2026 onwards. Overall, the conditions remain in place for euro area GDP growth to strengthen over the projection horizon. In particular, rising real wages and employment, less restrictive financing conditions – mainly reflecting recent monetary policy decisions – and a rebound in foreign demand in the later part of the projection horizon should all support a gradual recovery. Compared with the March 2025 projections, the outlook for GDP growth is unrevised for 2025, reflecting better than expected incoming data which are seen to be largely offset by the effects of the trade tensions and the appreciation of the euro exchange rate. The trade tensions and the stronger exchange rate have resulted in a downward revision to growth for 2026, while growth is unrevised for 2027.
In line with the June 2025 projections, survey data point overall to some weaker prospects in the near term. While manufacturing has strengthened, partly because trade has been brought forward in anticipation of higher tariffs, the more domestically oriented services sector is slowing. Higher tariffs and a stronger euro are expected to make it harder for firms to export. High uncertainty is expected to weigh on investment.
At the same time, several factors are keeping the economy resilient and should support growth over the medium term. A strong labour market, rising real incomes, robust private sector balance sheets and easier financing conditions, in part because of the Governing Council’s past interest rate cuts, should all help consumers and firms withstand the fallout from a volatile global environment. Recently announced measures to step up defence and infrastructure investment should also bolster growth.
In the present geopolitical environment, it is even more urgent for fiscal and structural policies to make the euro area economy more productive, competitive and resilient. The European Commission’s Competitiveness Compass provides a concrete roadmap for action, and its proposals, including on simplification, should be swiftly adopted. This includes completing the savings and investment union, following a clear and ambitious timetable. It is also important to rapidly establish the legislative framework to prepare the ground for the potential introduction of a digital euro. Governments should ensure sustainable public finances in line with the EU’s economic governance framework, while prioritising essential growth-enhancing structural reforms and strategic investment.
Inflation
Annual inflation declined to 1.9% in May, from 2.2% in April, according to Eurostat’s flash estimate. Energy price inflation remained at -3.6%. Food price inflation rose to 3.3%, from 3.0% the month before. Goods inflation was unchanged at 0.6%, while services inflation dropped to 3.2%, from 4.0% in April. Services inflation had jumped in April mainly because prices for travel services around the Easter holidays went up by more than expected.
Most indicators of underlying inflation suggest that inflation will stabilise sustainably at the Governing Council’s 2% medium-term target. Labour costs are gradually moderating, as indicated by incoming data on negotiated wages and available country data on compensation per employee. The ECB’s wage tracker points to a further easing of negotiated wage growth in 2025, while the June 2025 projections see wage growth falling to below 3% in 2026 and 2027. While lower energy prices and a stronger euro are putting downward pressure on inflation in the near term, inflation is expected to return to target in 2027.
Short-term consumer inflation expectations edged up in April 2025, likely reflecting news about trade tensions. But most measures of longer-term inflation expectations continue to stand at around 2%, which supports the stabilisation of inflation around the Governing Council’s target.
While headline inflation, as measured by the Harmonised Index of Consumer Prices (HICP), is likely to stay below 2% in the near term, it is expected to return to target in the medium term. Eurosystem staff expect inflation to decline in the course of 2025 and to reach a trough of 1.4% in the first quarter of 2026, before returning to 2.0% in 2027. The decline in headline inflation over 2025 is seen to be driven in part by negative energy inflation following the recent decline in oil prices and wholesale natural gas prices. Energy inflation is expected to remain negative until 2027 when new climate change mitigation measures come into effect in the context of the new Emissions Trading System (ETS2). Following a temporary increase in the second quarter of 2025, food inflation is expected to fall to rates slightly above 2% in 2027. HICP inflation excluding energy and food is expected to decline, driven by the services component, as the effects of delayed price adjustments for some items fade out, wage pressures recede, and lower energy prices feed through the pricing chain. Wage growth should continue to follow its downward path as pressures to recoup past real wage losses fade. Coupled with a recovery in productivity growth, this is expected to lead to significantly slower unit labour cost growth. External price pressures, as reflected in import prices, are expected to remain moderate assuming that EU tariff policies remain unchanged, with some downward pressure stemming from the stronger euro and the decline in energy commodity prices over recent months. Compared with the March 2025 projections, the outlook for headline HICP inflation is revised down by 0.3 percentage points for both 2025 and 2026 on account of lower energy commodity price assumptions and the appreciation of the euro, while it is unrevised for 2027.
Risk assessment
Risks to economic growth remain tilted to the downside. A further escalation in global trade tensions and associated uncertainties could lower euro area growth by dampening exports and dragging down investment and consumption. A deterioration in financial market sentiment could lead to tighter financing conditions and greater risk aversion, and make firms and households less willing to invest and consume. Geopolitical tensions, such as Russia’s unjustified war against Ukraine and the tragic conflict in the Middle East, remain a major source of uncertainty. By contrast, if trade and geopolitical tensions were resolved swiftly, this could lift sentiment and spur activity. A further increase in defence and infrastructure spending, together with productivity-enhancing reforms, would also add to growth.
The outlook for euro area inflation is more uncertain than usual, as a result of the volatile global trade policy environment. Falling energy prices and a stronger euro could put further downward pressure on inflation. This could be reinforced if higher tariffs led to lower demand for euro area exports and to countries with overcapacity rerouting their exports to the euro area. Trade tensions could lead to greater volatility and risk aversion in financial markets, which would weigh on domestic demand and would thereby also lower inflation. By contrast, a fragmentation of global supply chains could raise inflation by pushing up import prices and adding to capacity constraints in the domestic economy. A boost in defence and infrastructure spending could also raise inflation over the medium term. Extreme weather events, and the unfolding climate crisis more broadly, could drive up food prices by more than expected.
Financial and monetary conditions
Risk-free interest rates have remained broadly unchanged since the Governing Council’s monetary policy meeting on 17 April 2025. Equity prices have risen, and corporate bond spreads have narrowed, in response to more positive news about global trade policies and the improvement in global risk sentiment.
The Governing Council’s past interest rate cuts continue to make corporate borrowing less expensive. The average interest rate on new loans to firms declined to 3.8% in April, from 3.9% in March. The cost of issuing market-based debt was unchanged at 3.7%. Bank lending to firms continued to strengthen gradually, growing by an annual rate of 2.6% in April after 2.4% in March, while corporate bond issuance was subdued. The average interest rate on new mortgages stayed at 3.3% in April, while growth in mortgage lending increased to 1.9%.
In line with its monetary policy strategy, the Governing Council thoroughly assessed the links between monetary policy and financial stability. While euro area banks remain resilient, broader financial stability risks remain elevated, in particular owing to highly uncertain and volatile global trade policies. Macroprudential policy remains the first line of defence against the build-up of financial vulnerabilities, enhancing resilience and preserving macroprudential space.
Monetary policy decisions
The interest rates on the deposit facility, the main refinancing operations and the marginal lending facility were decreased to 2.00%, 2.15% and 2.40% respectively, with effect from 11 June 2025.
The asset purchase programme and the pandemic emergency purchase programme portfolios are declining at a measured and predictable pace, as the Eurosystem no longer reinvests the principal payments from maturing securities.
Conclusion
At its meeting on 5 June 2025, the Governing Council decided to lower the three key ECB interest rates by 25 basis points. In particular, the decision to lower the deposit facility rate – the rate through which the Governing Council steers the monetary policy stance – was based on its updated assessment of the inflation outlook, the dynamics of underlying inflation and the strength of monetary policy transmission. The Governing Council is determined to ensure that inflation stabilises sustainably at its 2% medium-term target. Especially in current conditions of exceptional uncertainty, it will follow a data-dependent and meeting-by-meeting approach to determining the appropriate monetary policy stance. The Governing Council’s interest rate decisions will be based on its assessment of the inflation outlook in light of the incoming economic and financial data, the dynamics of underlying inflation and the strength of monetary policy transmission. The Governing Council is not pre-committing to a particular rate path.
In any case, the Governing Council stands ready to adjust all of its instruments within its mandate to ensure that inflation stabilises sustainably at its medium-term target and to preserve the smooth functioning of monetary policy transmission.
1 External environment
Higher tariff rates imposed by the US Administration, along with elevated trade policy uncertainty, are shaping the global economic outlook. Since the finalisation of the March 2025 ECB staff macroeconomic projections for the euro area on 6 February 2025, the effective tariff rate on goods imports into the United States has increased significantly. Although the US Administration raised tariffs on imports from all its trading partners, the increase in tariffs on China has been most pronounced, notwithstanding a recent agreement to temporarily lower tariff rates. These developments are contributing to frictions in global trade and to higher trade policy uncertainty, which could have knock-on effects on economic activity and dampen the global growth outlook. In the June 2025 Eurosystem staff macroeconomic projections for the euro area, the outlook for global growth was revised down by a cumulative 0.7 percentage points over the projection horizon until the end of 2027. The deterioration of the growth outlook is evident across all key economies, but most notably the United States and China. Globally, headline CPI inflation is expected to moderate over the projection horizon, though projected inflation has been revised upward in the United States, reflecting the impact of the newly announced tariffs.
Growth in global activity declined in the first quarter of 2025 and is expected to moderate further. Global real GDP growth (excluding the euro area) fell to an estimated 0.7% quarter on quarter in the first quarter of 2025, down from 1.1% in the fourth quarter of 2024.[1] Global economic activity is expected to weaken further and remain at subdued levels for the rest of the year. The global economic activity tracker developed by ECB staff points to a moderation in activity as of April, as latest survey data have brought the index below its historical average. The global composite output Purchasing Managers’ Index (PMI) declined in April 2025, largely due to slower growth in services sector output (Chart 1).
Chart 1
Global output PMI (excluding the euro area)
(diffusion indices)

Sources: S&P Global Market Intelligence and ECB staff calculations.
Note: The latest observations are for May 2025 for the manufacturing output index and April 2025 for the services and composite output indices.
Trade conflicts are weakening the global growth outlook. Global growth is projected to slow over the projection horizon, further below its pre-pandemic average. According to the June 2025 Eurosystem staff macroeconomic projections, global real GDP is projected to grow by 3.1% in 2025, a slowdown compared with the 3.6% growth recorded last year.[2] Global real GDP growth is projected to decrease further to 2.9% in 2026 before stabilising at 3.2% in 2027. Compared with the March 2025 ECB staff macroeconomic projections, global growth for both 2025 and 2026 has been revised down by 0.3 percentage points, while remaining unchanged for 2027. The deterioration in the growth outlook is visible across all key economies but is especially pronounced in the United States and China. Tariffs and policy uncertainty are two major factors behind the downward revisions. Tariffs are detrimental to growth as they increase the costs of final and intermediate goods imported from abroad. This in turn weighs on domestic consumption and erodes the competitiveness of exporters by pushing up production costs. Elevated uncertainty prompts precautionary behaviour among consumers and firms, who hold back on consumption and investment. The balance of risks surrounding the global growth projections is tilted to the downside and hinges in particular on future trade policy developments. Specifically, the US Administration and its partners successfully concluding trade negotiations could lead to lower tariffs and support global activity. Conversely, higher tariffs and potential retaliation by trading partners could further dampen growth prospects.
Global trade growth is projected to decrease significantly over the next two years. The monthly global trade tracker developed by ECB staff suggests that global imports started slowing considerably as of April. This reading was driven largely by high-frequency data such as lower commodity imports by China and declining equity prices of companies involved in the global goods trade, including shipping and packaging firms. This finding is also supported by survey indicators. The new orders index in the global manufacturing PMI (excluding the euro area) fell further into contractionary territory in April. The decline was particularly pronounced for Canada and Mexico, while the indices for the United States and China saw smaller declines but remained in expansionary territory. This slowdown follows strong US import growth in the first quarter of 2025, reflecting the frontloading of imports that occurred in anticipation of higher tariffs. In line with this, higher export rates were observed in countries facing higher tariffs, including Canada, several Asian economies and the United Kingdom. According to the June 2025 Eurosystem staff macroeconomic projections, global import growth is expected to decline from 4.1% in 2024 to 3.1% in 2025, before falling further to 1.7% in 2026 and increasing to 3.1% in 2027. The projected sharp slowdown reflects the impact of tariffs and elevated trade policy uncertainty, with the latter weighing heavily on trade-intensive demand components like investment. Compared with the March projections, expected world import growth has been revised down by 0.4 percentage points for 2025 and 1.4 percentage points for 2026, largely owing to the newly implemented tariffs and, to a lesser extent, elevated trade policy uncertainty; it remains unchanged for 2027. These revisions are largely driven by significantly weaker imports in the United States, as well as weaker import growth in the rest of the world, including China.
Headline inflation across the member countries of the Organisation for Economic Co-operation and Development (OECD) has decreased. In April 2025 the annual rate of consumer price index (CPI) inflation across OECD members (excluding Türkiye) edged down to 2.6% from 2.7% in the previous month (Chart 2). This downtick masks two opposing developments, however, as the impact of lower inflation in the food and energy components is set against slightly higher core CPI inflation, which increased to 3.1% from 3.0% in the previous month.
Chart 2
OECD CPI inflation
(year-on-year percentage changes, percentage point contributions)
Sources: OECD and ECB staff calculations.
Notes: The OECD aggregate excludes Türkiye and is calculated using OECD CPI annual weights. The latest observations are for April 2025.
Annual headline CPI inflation across a broad group of advanced economies and emerging markets is projected to moderate over the projection horizon. For the United States, headline CPI inflation was revised up, owing to the impact of significantly higher tariffs affecting more than 80% of the country’s goods imports. Among advanced economies, inflation in the United Kingdom was also revised up for this year, driven by higher than previously expected outturns in recent months and stronger wage growth. However, the inflation outlook for the UK economy remains unchanged over the rest of the projection horizon. Inflation projections for emerging market economies remain broadly unchanged compared with the March 2025 projections, as the impact of the worsened inflation outlook in Russia was offset by lower projected inflation in China. Russia’s inflation outlook reflects adverse structural developments, while in China, lower inflation reflects weak domestic demand. In annual terms, a global composite of headline CPI inflation is still projected to follow a downward trend, moderating to 3.3% this year from 4.0% in 2024. Over the medium term, inflation is expected to decline further to 2.8% in 2026 and 2.5% in 2027.[3]
Over the review period from 16 April to 4 June 2025, Brent crude oil prices decreased as supply-side factors outweighed the improved market sentiment. Initially, crude oil prices were supported by a recovery in risk sentiment reflecting a de-escalation in trade tensions. However, this was more than offset by supply-side factors, particularly the recent OPEC+ decision to raise production levels by 411,000 barrels per day in July – more than three times the initially planned volume. In April the cartel of oil-producing countries led by Saudia Arabia had already surprised the markets by announcing a similar increase in production for May. If this upturn in production becomes more permanent, it could bring about larger downside risks to the price of oil. Falling oil prices are already weighing on investment plans among US shale oil producers, as current prices are approaching or falling below their marginal breakeven levels – the price needed for them to profitably drill a new well. This is reflected in a sharp decline in the number of oil rigs and active fracking engineering teams. Additionally, several shale oil producers have recently announced cuts to their capital spending.
European gas prices increased over the review period, owing to a combination of supply and demand factors. Initially, gas prices fell, amid trade tensions and discussions within European institutions about easing regulatory storage targets for the upcoming heating season. These developments pushed short-term gas futures below longer-term prices, causing the spread between summer and winter futures to turn negative again, which, in turn, incentivised storage restocking. Gas prices subsequently rebounded on the back of latest trade agreements, unplanned outages at Norwegian liquefied natural gas processing plants and the European Commission’s plan to phase out Russian gas imports by 2027. Metal and food prices also increased, driven primarily by demand factors. Food prices were supported by resilient demand for cocoa semi-finished products, despite the sharp surge in cocoa prices earlier this year. Metal prices increased, driven by rising copper prices. The initial support came from sustained precautionary imports in the United States, driven by concerns over higher tariffs on imported copper. This was later reinforced by improved market sentiment following the easing of trade tensions between China and the United States.
In the United States, the growth outlook has deteriorated since the finalisation of the March 2025 ECB staff macroeconomic projections on 6 February 2025. Real GDP turned slightly negative in the first quarter of 2025, as the frontloading of imports resulted in a large negative contribution from net trade. At the same time, domestic demand remained relatively solid; it is, however, expected to slow down as the impact of tariffs take hold. In general, the broad and elevated tariffs are projected to increase the cost of imported intermediate and final goods, which will likely spill over to domestic prices. The June 2025 projections point to reduced trade flows and higher production costs, as well as lower domestic demand as households’ real disposable incomes declines due to higher inflation. The negative impact of tariffs on the outlook is further compounded by rising policy uncertainty, prompting precautionary saving and delayed investment. Tighter financial conditions, resulting in negative wealth effects and higher financing costs, are also dampening the outlook. On the nominal side, consumer inflation measures are not yet reflecting the impact of tariff-driven price pressures. Annual headline CPI inflation slowed to 2.3% in April from 2.4% in March. Core CPI inflation, which excludes food and energy price components, remained unchanged at 2.8% in April. Although the impact of tariffs is not yet evident in the CPI inflation data, high-frequency price data from large retailers point to upward pressures, mostly stemming from increased prices for imported goods, particularly from China. In May the Federal Open Market Committee kept the target range for the federal funds rate unchanged at 4.25-4.50% amid rising risks and uncertainty about the outlook.
In China, real GDP growth was strong in the first quarter of 2025, boosted by robust domestic demand and frontloaded exports. However, high US tariffs and ongoing adjustments in the real estate sector are expected to weigh on economic activity going forward. Activity indicators softened in April, with annual growth in retail sales declining to 5.1% in April, down from 5.9% in the previous month, but remaining above the January-February average. Annual growth in industrial production declined to 6.1%, while investment eased across all components. The manufacturing PMI for new export orders declined sharply in April. Overall, activity data point to some further softening in already subdued domestic demand, with higher US tariffs weighing on the near-term growth outlook. Deflationary pressures in the Chinese economy persist. Annual headline CPI inflation remained negative in April at -0.1%, while producer price inflation decreased further to -2.7%. As US tariffs on Chinese imports remain high despite the temporary trade agreement, pressure on Chinese exporters continues. The current profit margins of Chinese exporting firms mean they have room to lower export prices further. Combined with continued weak domestic demand and industrial overcapacity, export price deflation is likely to persist going forward.
In the United Kingdom, real GDP growth picked up in the first quarter of 2025, driven by strong investment growth and net trade. This pick-up is likely to be short-lived, however, as growth is expected to decrease, reflecting elevated uncertainty and global trade tensions. Available short-term indicators, including PMI surveys and trackers of consumer and business confidence, suggest a rather weak start to the second quarter of 2025. Despite recent positive trade policy news – including bilateral trade agreements with the United States and India, as well as a new deal with the EU – uncertainty remains elevated against the backdrop of high tariffs. Annual headline CPI inflation rose sharply in April, up to 3.5% from 2.6% in March. The increase was driven by higher services and energy inflation, while core goods inflation remained unchanged. Looking ahead, headline inflation is projected to remain above the Bank of England’s 2% target throughout 2025. At its May meeting, the Bank of England reduced its key policy rate by 25 basis points to 4.25%.
2 Economic activity
According to the information available at the cut-off date, the euro area economy grew by 0.3% in the first quarter of 2025, after expanding by 0.2% in the fourth quarter of 2024, with modest contributions from domestic demand and net trade.[4] Employment rose by 0.3% in the first quarter, at the same pace as GDP. Across sectors, industrial activity is expected to have recovered, reflecting improved demand for capital goods, partly because trade has been brought forward in anticipation of higher tariffs. At the same time, the services sector is likely to have seen only modest growth. Survey indicators point to a slowdown in activity in the second quarter of 2025. In May, the composite output Purchasing Managers’ Index (PMI) fell to close to the level of the growth threshold, while manufacturing output was above the growth threshold for the third consecutive month. At the same time, services fell slightly vis-à-vis the first quarter. Further headwinds are likely to come from rising protectionism and trade-distorting measures, which might disproportionately affect the manufacturing sector compared with other parts of the economy. While the labour market has softened over recent months, it continues to be solid. Looking ahead, the high level of uncertainty, trade tensions and persisting competitiveness losses are expected to limit the speed of the euro area’s economic recovery. Nonetheless, the projected recovery should be supported by higher labour incomes and more affordable credit, in part because of past interest rate cuts.
This outlook is reflected in the baseline scenario of the June 2025 Eurosystem staff macroeconomic projections for the euro area, which foresee annual real GDP growth of 0.9% in 2025, 1.1% in 2026 and 1.3% in 2027.[5]In addition, two alternative scenarios were prepared to illustrate some of the mechanisms by which different trade policies could affect growth and inflation: (i) a mild scenario which foresees the removal of bilateral tariffs between the United States and the EU, and (ii) a severe scenario which foresees a further increase in US tariffs across the board, symmetric retaliation by the EU and persistently higher trade policy uncertainty. In the mild scenario, growth would be somewhat stronger in 2025-26 than in the baseline projections. In the severe scenario, the growth outlook would be considerably weaker throughout the projection horizon.
According to Eurostat’s flash estimate, real GDP edged up by 0.3%, quarter on quarter, in the first quarter of 2025 (Chart 3). This means that output has risen for five consecutive quarters amid trade tariff discussions, financial market tensions and geopolitical uncertainty, supporting the notion that the euro area economy is building up some resilience to global shocks. Short-term indicators and available country data point to positive, albeit moderate, contributions from private consumption and investment. Net exports are also expected to have made a positive contribution, supported by the frontloading of exports to the United States following the tariff announcements. On the production side, the industrial sector is likely to have recovered on the back of frontloaded exports. Value added in both the construction and services sectors also appears to have shown modest positive growth in the first quarter.
Chart 3
Euro area real GDP and its components
(quarter-on-quarter percentage changes; percentage point contributions)
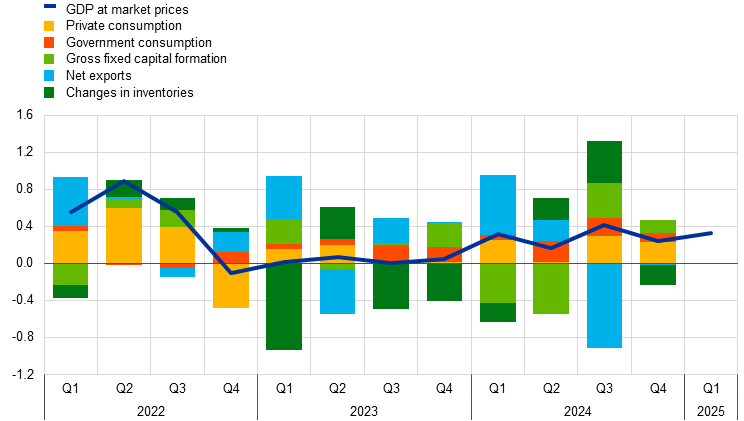
Sources: Eurostat and ECB calculations.
Note: The latest observations are for the first quarter of 2025 for GDP and for the fourth quarter of 2024 for the expenditure breakdown.
Survey data point to a slowdown in growth in the second quarter of 2025, amid elevated uncertainty. Uncertainty surrounding economic policy – including trade policy – at the global level continues to weigh on the near-term outlook. The composite output PMI fell back slightly to 50.3 on average in April and May (from 50.4 in the first quarter), indicating stagnating output. While the manufacturing output PMI has improved to levels not seen since the beginning of 2022, pointing now to growth, business activity in the services sector has declined, standing at levels indicative of falling activity (Chart 4). The PMI for new orders – which is more forward looking by nature – portrays a similar picture, with an overall lacklustre performance masking improving manufacturing and slowing services activity. Following some positive short-term effects, such as increased production from the frontloading of exports, higher tariffs might have a disproportionately adverse effect on the manufacturing sector compared with other parts of the economy in the months ahead.
Chart 4
PMI indicators across sectors of the economy
a) Manufacturing | b) Services |
|---|---|
(diffusion indices) | (diffusion indices) |
 |  |
Source: S&P Global Market Intelligence.
Note: The latest observations are for May 2025.
Employment increased by 0.3% in the first quarter of 2025. After a more muted rise of 0.1% in the fourth quarter of 2024, employment growth increased in the first quarter of 2025, standing at 0.3% (Chart 5).[6] This performance masks diverging trends across the euro area. Among the main euro area countries, employment was mainly driven by Italy and Spain. At the same time, the unemployment rate stood at 6.2% in April, remaining broadly at this level since mid-2024. Labour demand declined further, with the job vacancy rate falling to 2.4% in the first quarter, 0.1 percentage points below the level seen in the fourth quarter of 2024.
Chart 5
Euro area employment, PMI assessment of employment and unemployment rate
(left-hand scale: quarter-on-quarter percentage changes, diffusion index; right-hand scale: percentages of the labour force)
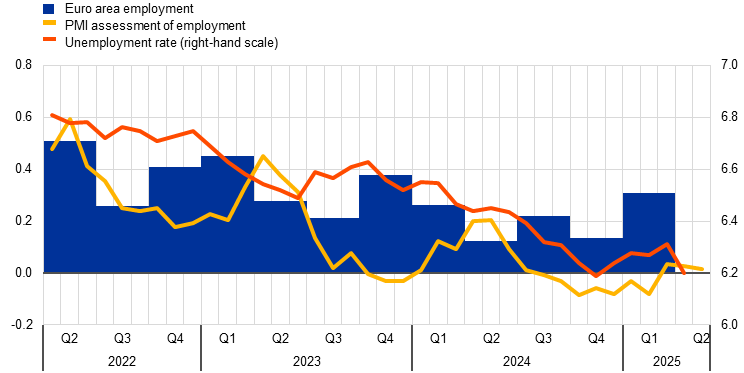
Sources: Eurostat, S&P Global Market Intelligence and ECB calculations.
Notes: The two lines indicate monthly developments, while the bars show quarterly data. The PMI is expressed in terms of the deviation from 50, then divided by 10 to gauge the quarter-on-quarter employment growth. The latest observations are for the first quarter of 2025 for euro area employment, May 2025 for the PMI assessment of employment and April 2025 for the unemployment rate.
Short-term labour market indicators point to flat employment growth in the second quarter. The monthly composite PMI employment indicator declined from 50.3 in April to 50.2 in May, suggesting broadly flat employment growth. The PMI employment indicator for services declined from 51.3 in April to 50.9 in May, while the PMI employment indicator for manufacturing recovered slightly, from 47.4 to 48.1.
Private consumption likely grew at a more moderate pace in the first quarter of 2025. After increasing by 0.4%, quarter on quarter, in the fourth quarter of 2024 (Chart 6, panel a), private consumption growth seems to have slowed slightly in the first quarter of 2025, reflecting moderate spending on services and a renewed softening in the consumption of goods. Incoming data point to moderating momentum in household spending growth in the short term. While the European Commission’s consumer confidence indicator improved in May amid easing trade tensions, having declined sharply in April, it remains subdued and well below its average outcome for the first quarter of the year (Chart 6, panel b). Moreover, consumer uncertainty remains elevated. The European Commission’s indicators of business expectations for demand in contact-intensive services rose in May after dropping further into negative territory in April (Chart 6, panel a). By contrast, the ECB’s latest Consumer Expectations Survey indicates that expected holiday purchases continue to be robust. At the same time, consumer expectations for major purchases in the next 12 months improved in May, while expectations for retail trade declined further for the fifth consecutive month. Looking ahead, despite the ongoing support from recent purchasing power gains, persisting economic policy uncertainty – particularly in the context of global economic developments – should continue to weigh on households’ spending decisions.
Chart 6
Private consumption, business expectations for retail trade and contact-intensive services; consumer confidence and uncertainty
a) Consumption and business expectations | b) Consumer confidence and uncertainty |
|---|---|
(quarter-on-quarter percentage changes; standardised percentage balances) | (standardised percentage balances) |
 |  |
Sources: Eurostat, European Commission and ECB calculations.
Notes: Business expectations for retail trade (excluding motor vehicles) and expected demand for contact-intensive services refer to the next three months; “contact-intensive services” refer to accommodation, travel and food services. The contact-intensive services series is standardised for the period from 2005 to 2019 and consumer uncertainty is standardised for the period from April 2019 to May 2025 with respect to the average for the fourth quarter of 2021, owing to data availability, while all other series are standardised for the period from 1999 to 2019. The latest observations are for the fourth quarter of 2024 for private consumption and for May 2025 for all other items.
Business investment was likely bolstered by some frontloading in the first quarter of 2025 but is expected to slow further ahead, given the ongoing trade tensions.[7] Available indicators – such as capital goods production, which grew by 0.6% quarter on quarter, excluding Ireland, in the first quarter – likely reflect frontloaded exports and inventory accumulation following the initial changes (and expected further changes) to US tariffs, rather than any underlying acceleration in investment. Current signals remain mixed, with the PMIs for the capital goods sector – the suppliers of many investment goods – showing notable (but likely temporary) increases in output, while the European Commission’s confidence indicator for the sector remains weak amid declining production expectations (Chart 7, panel a). Against this background of heightened trade tensions and associated uncertainty, business investment is likely to be postponed and remain subdued throughout 2025. The most recent biannual investment survey carried out by the European Commission already suggested that growth was likely to be modest in 2025. Information from the latest ECB Investment Survey (see Box 3) and the May 2025 Non-Financial Business Sector Dialogue also points to only a modest increase in investment for the year, as firms delay decisions in the light of prevailing uncertainties.[8] However, barring further escalations in trade tensions, as uncertainty declines, domestic demand strengthens and financing conditions ease, euro area investment is expected to gradually recover, also supported by enhanced EU and national policy initiatives.
Chart 7
Real investment dynamics and survey data
a) Business investment | b) Housing investment |
|---|---|
(quarter-on-quarter percentage changes; percentage balances and diffusion index) | (quarter-on-quarter percentage changes; percentage balances and diffusion index) |
 |  |
Sources: Eurostat, European Commission (EC), S&P Global Market Intelligence and ECB calculations.
Notes: Lines indicate monthly developments, while bars refer to quarterly data. The PMIs are expressed in terms of the deviation from 50. In panel a), business investment is measured by non-construction investment excluding Irish intangibles. Short-term indicators refer to the capital goods sector. In panel b), the line for the European Commission’s activity trend indicator refers to the weighted average of the building and specialised construction sectors’ assessment of the trend in activity compared with the preceding three months, rescaled to have the same standard deviation as the PMI. The line for PMI output refers to housing activity. The latest observations are for the fourth quarter of 2024 for investment, April 2025 for PMI output and May 2025 for the European Commission’s indicators.
Housing investment likely increased noticeably in the first quarter of 2025. According to available country data, housing investment increased by 0.9%, quarter on quarter, in the first quarter of 2025, having contracted further in the fourth quarter of 2024. Building construction production and specialised construction activities grew by 0.3%, following a stronger rise of 0.7% in the previous quarter. Looking ahead, survey-based activity indicators convey mixed signals. The European Commission’s trend indicator for building construction output and specialised construction activities remained largely stable on average in April and May, whereas the PMI for residential construction output recorded a notable improvement in April (Chart 7, panel b). Although both indicators remained in negative growth territory, housing investment is expected to see a moderate increase in the near term. This outlook is supported by a continued rise in building permits for residential buildings in the first quarter of 2025, as well as a significant improvement in the European Commission's assessment of order books for building construction companies in April and May compared with the first-quarter average. Together, these developments point to strengthening demand for new residential buildings, which bodes well for the future momentum of housing investment.
Exports of euro area goods rose substantially in the first quarter of 2025, boosted by US tariff-related frontloading; yet challenges persist. Frontloading in response to impending US tariffs boosted extra-euro area goods export volumes, which rose substantially in the first quarter of 2025 (4.9% in three-month-on-three-month terms). This was driven chiefly by pharmaceutical exports, mainly from Ireland and via Switzerland, but also from Germany, France and Italy. While more frontloading may take place in the coming months, higher tariffs, policy uncertainty and the appreciation of the euro are expected to cause headwinds for export volumes further ahead. On the import side, the appreciation of the euro and trade deflection resulting from US-China trade tensions are likely to dampen import prices given that more than half of the moderate growth in goods imports of 1.3% in three-month-on-three-month terms in the first quarter was driven by increasing imports from China.
Compared with the March 2025 projections, real GDP growth is unrevised for 2025 and 2027 but has been revised down slightly for 2026. According to the June 2025 Eurosystem staff projections, the economy is expected to grow by 0.9% in 2025, 1.1% in 2026 and 1.3% in 2027. The unrevised projection for 2025 reflects a stronger than expected first quarter combined with weaker prospects for the remainder of the year. While the uncertainty surrounding trade policies is expected to weigh on business investment and exports in the short term, rising government investment related to defence and infrastructure spending will increasingly support growth over the medium term. Higher real incomes and a robust labour market will allow households to spend more. Together with more favourable financing conditions, this should make the economy more resilient to global shocks.
3 Prices and costs
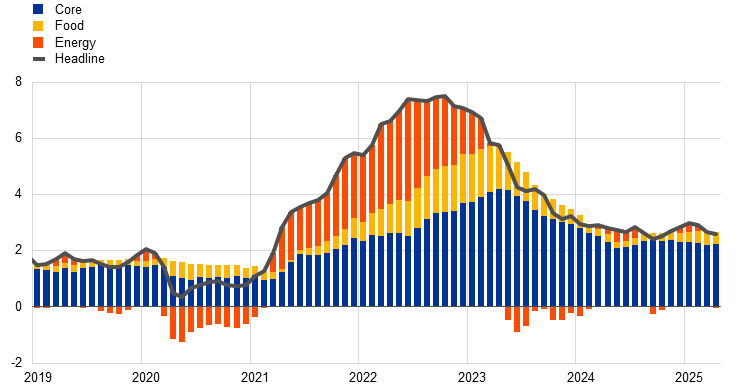
Euro area headline inflation is currently at around the Governing Council’s 2% medium-term target. According to Eurostat’s flash estimate, it decreased to 1.9% in May 2025 from 2.2% in April. This decline solely reflects a drop in HICP inflation excluding energy and food (HICPX), which was driven by a marked fall in services inflation. Food inflation increased, while energy inflation and non-energy industrial goods inflation were unchanged. Most measures of underlying inflation suggest that inflation will stabilise sustainably at the ECB’s 2% medium-term target. Wage growth is still elevated but continues to moderate visibly, and profits are partially buffering its impact on inflation. Most measures of longer-term inflation expectations continue to stand at around 2%. Inflation has continued to develop broadly as projected by Eurosystem staff.
The June 2025 Eurosystem staff macroeconomic projections for the euro area foresee headline inflation averaging 2.0% in 2025, 1.6% in 2026 and 2.0% in 2027. The downward revisions in headline inflation for 2025 and 2026 compared with the previous projections mainly reflect lower assumptions for energy prices and a stronger euro, and lower core inflation in 2026.[9] Amid heightened uncertainty, the June staff projections explored, in alternative illustrative scenarios, some of the mechanisms by which different trade policies could affect inflation. A resolution of trade tensions with a benign outcome would lead to slightly higher inflation compared with the above baseline projections, while an escalation would lower inflation below baseline levels.[10]
According to Eurostat’s flash estimate, euro area headline inflation, as measured by the Harmonised Index of Consumer Prices (HICP), declined to 1.9% in May from 2.2% in April (Chart 8). This decrease resulted solely from a drop in HICP inflation excluding energy and food (HICPX), which was related to lower services inflation. Energy inflation was unchanged at -3.6% in May, reflecting a strong upward base effect, i.e. a significant month-on-month decline was masked by a similarly large decline a year previously. By contrast, food inflation increased to 3.3% in May from 3.0% in April. This increase was driven by a higher annual rate for processed food prices, which more than offset a decline in the annual rate for unprocessed food prices. HICPX inflation decreased to 2.3% in May from 2.7% in April. This reflected a fall in services inflation to 3.2% in May from 4.0% in April, while non-energy industrial goods inflation was unchanged at a moderate rate of 0.6% for the fourth consecutive month. The drop in services inflation in May could be a correction from the April price surge in travel-related services, which was due to the Easter period.
Chart 8
Headline inflation and its main components
(annual percentage changes; percentage point contributions)

Sources: Eurostat and ECB calculations.
Notes: “Goods” refers to non-energy industrial goods. The latest observations are for May 2025 (Eurostat’s flash estimate).
Available data for May indicate that measures of underlying inflation linked to travel-related services eased after rising in April, while other indicators only available until April showed mixed signals. In April 2025 the indicator values for underlying inflation ranged between 2.2% and 2.9%.[11] Data available for May show that HICP excluding energy and HICP excluding energy and unprocessed food, which include travel-related services items, declined to 2.5% and 2.4%, from 2.8% and 2.7% in April respectively. By contrast, HICP inflation excluding travel-related services items, clothing and footwear (HICPXX) was unchanged at 2.6% in April. The Persistent and Common Component of Inflation (PCCI), which tends to be the underlying inflation indicator that performs best as a predictor of future headline inflation, was unchanged at 2.2%, at the lower end of the range, while the weighted median indicator increased to 2.9%. The Supercore indicator (which comprises HICP items sensitive to the business cycle) stayed at 2.6%. Domestic inflation, which excludes some travel‑related items but includes accommodation, stood at 3.9% for the third consecutive month.
Chart 9
Indicators of underlying inflation
(annual percentage changes)
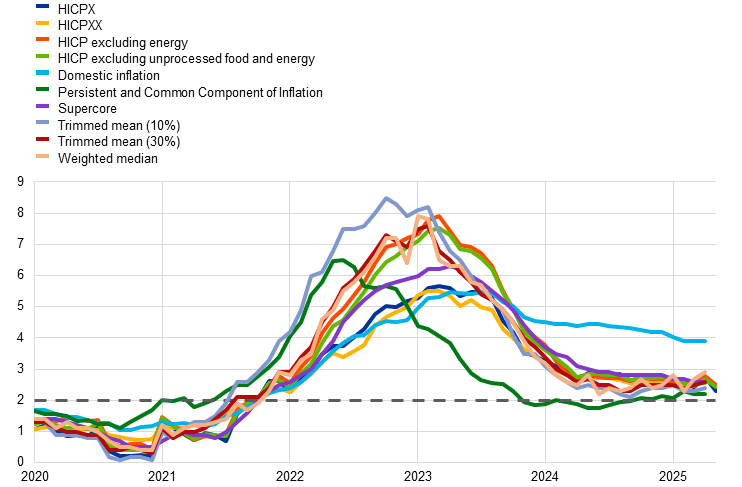
Sources: Eurostat and ECB calculations.
Notes: The grey dashed line represents the ECB’s inflation target of 2% over the medium term. The latest observations are for May 2025 (Eurostat’s flash estimate) for HICPX, HICP excluding energy and HICP excluding unprocessed food and energy, and for April 2025 for all other indicators.
Most indicators of pipeline pressures for goods eased in March and remain at moderate rates (Chart 10). At the early stages of the pricing chain, producer price inflation for energy decreased to 3.8% in March from 7.6% in February. The annual growth rate of producer prices for domestic sales of intermediate goods edged down to 0.8% in March from 0.9% in February. At the later stages of the pricing chain, domestic producer price inflation for non-food consumer goods fell to 1.4% in March from 1.5% in February, while producer prices for the manufacturing of food products increased to 1.6% from 1.4%. Import price inflation for manufactured food declined to 8.8% in March from 9.6% in February, remaining at an elevated level. For intermediate goods, the annual growth rate of import prices decreased to 1.7% from 2.7%. The lower rates of import price inflation partly reflect the recent appreciation of the euro.
Chart 10
Indicators of pipeline pressures
(annual percentage changes)
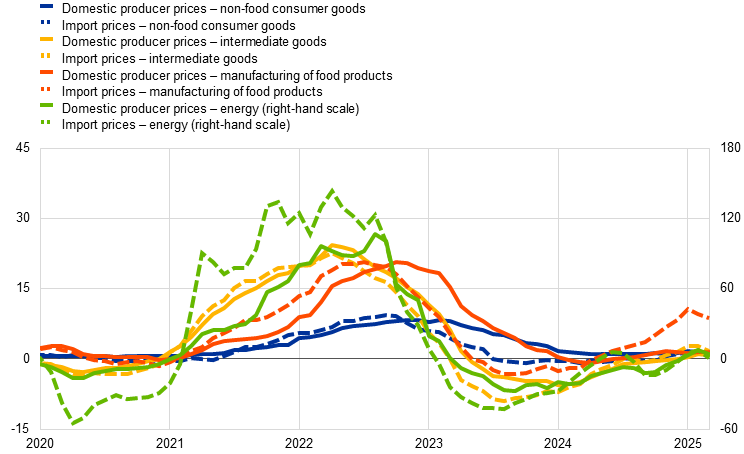
Sources: Eurostat and ECB calculations.
Note: The latest observations are for March 2025.
Domestic cost pressures, as measured by growth in the GDP deflator, eased in the fourth quarter of 2024 for the seventh consecutive quarter (Chart 11). The latest available national accounts data for domestic cost pressures for the euro area refer to the fourth quarter of 2024. The annual growth rate of the GDP deflator slowed to 2.5% in the fourth quarter of 2024, from 2.7% in the previous quarter. This reflects a smaller contribution from unit labour costs and a negative contribution from unit profits, which outweighed the slight increase in unit net taxes. Available indicators on wage growth for the first quarter of 2025 confirm that the growth of labour costs has slowed further. The flash estimate of the labour cost index showed a decline to 3.3% in the first quarter of 2025 from 4.1% in the fourth quarter of 2024. The growth rate of negotiated wages also fell in the first quarter of 2025, to 2.4% from 4.1% in the previous quarter. Looking ahead, the ECB’s forward‑looking wage tracker, which incorporates data on negotiated wage agreements up to May 2025, continues to point to easing wage growth pressures throughout 2025.
Chart 11
Breakdown of the GDP deflator
(annual percentage changes; percentage point contributions)

Sources: Eurostat and ECB calculations.
Notes: Compensation per employee contributes positively to changes in unit labour costs. Labour productivity contributes negatively. The latest observations are for the fourth quarter of 2024.
In the period from the April Governing Council meeting there was little change in market-based and survey-based indicators of longer-term inflation expectations, while market-based measures of short-term inflation compensation declined to levels below 2% (Chart 12). In both the ECB Survey of Professional Forecasters for the second quarter of 2025 and the ECB Survey of Monetary Analysts for June 2025, average and median longer-term inflation expectations remained at 2%. Shorter-term survey expectations for 2025 also stood at around 2%, with small changes reflecting recent data outcomes and movements in energy commodity prices. The one-year forward inflation‑linked swap rate one year ahead, a market-based measure of short-term inflation compensation, declined by 0.2 percentage points to around 1.7% over the review period, suggesting that trade uncertainty is largely seen as disinflationary for the euro area by market participants. At medium and longer‑term maturities, after the US tariff announcements, inflation compensation largely retraced the strong upward repricing which had followed the German Government’s fiscal announcement. This development left five‑year forward inflation-linked swap rates five years ahead close to 2%. Consumers’ short-term inflation expectations increased slightly, while their medium-term expectations remained stable. According to the ECB Consumer Expectations Survey for April 2025, median expectations for headline inflation over the next 12 months rose to 3.1% in April from 2.9% in March. However, expectations for three years ahead were unchanged at 2.5%. Meanwhile, the median rate of perceived inflation over the previous 12 months also stayed at 3.1%. The uptick in short-term inflation expectations may reflect an increase in inflation uncertainty and a deterioration in the economic sentiment of the survey’s participants.
Chart 12
Market-based measures of inflation compensation and consumer inflation expectations
a) Market-based measures of inflation compensation
(annual percentage changes)

b) Headline HICP inflation and ECB Consumer Expectations Survey
(annual percentage changes)
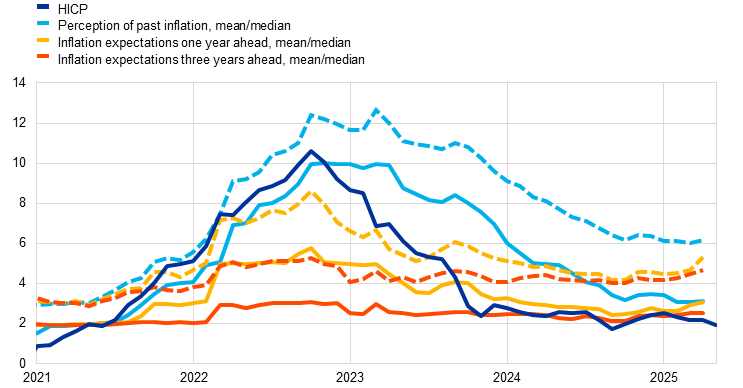
Sources: LSEG, Eurostat, ECB Consumer Expectations Survey and ECB calculations.
Notes: Panel a) shows forward inflation-linked swap rates over different horizons for the euro area. The vertical grey line indicates the start of the review period on 6 March 2025. In panel b), the dashed lines show the mean rate, and the solid lines show the median rate. The latest observations are for 4 June 2025 for panel a), and May 2025 (Eurostat’s flash estimate) for HICP and April 2025 for the other measures in panel b).
The June 2025 projections expect headline inflation to average 2.0% in 2025 and 1.6% in 2026, before returning to 2.0% in 2027 (Chart 13). Headline inflation is expected to decline to below 2% in the second quarter of 2025 and to reach a trough of around 1.4% in early 2026, reflecting a decline in all main components: energy, food and core inflation (the latter driven mainly by services). Headline inflation is then expected to increase in 2027. This projected increase mainly reflects a temporary upward impact from energy inflation in 2027, owing to fiscal measures related to the climate transition, particularly the introduction of a new Emissions Trading System. Compared with the March 2025 projections, the outlook for headline inflation has been revised down by 0.3 percentage points for both 2025 and 2026, while it is broadly unrevised for 2027. The downward revision for 2025 is entirely driven by energy inflation, reflecting weaker than expected data and lower price assumptions for oil, gas and electricity. HICPX inflation is expected to average 2.4% in 2025, and 1.9% in 2026 and 2027, as the effects of past large shocks on services inflation continue to fade. Compared with the March 2025 projections, HICPX inflation has been revised up by 0.2 percentage points for 2025 and has been revised down by 0.1 percentage points for 2026.
Chart 13
Euro area HICP and HICPX inflation
(annual percentage changes)

Sources: Eurostat and Eurosystem staff macroeconomic projections for the euro area, June 2025.
Notes: The grey vertical line indicates the last quarter before the start of the projection horizon. The latest observations are for the first quarter of 2025 for the data and the fourth quarter of 2027 for the projections. The June 2025 projections were finalised on 21 May 2025 and the cut-off date for the technical assumptions was 14 May 2025. Both historical and projected data for HICP and HICPX inflation are reported at a quarterly frequency.
4 Financial market developments
During the review period from 6 March to 4 June 2025, developments in euro area financial markets were predominantly driven by the heightened uncertainty surrounding trade policies. The announcement of sweeping US tariffs on 2 April led to a sharp repricing of financial assets, while relief following the subsequent suspension of these tariffs sparked a recovery in risk asset markets. However, elevated tariff uncertainty and a clouded economic outlook continued to weigh on financial markets. Overall, the risk-free euro short-term rate (€STR) forward curve shifted down, with markets at the end of the review period pricing in almost 60 basis points of cumulative interest rate cuts in the euro area by the end of 2025. Long-term sovereign bond yields also declined amid trade tensions, accompanied by a compression of spreads relative to the corresponding overnight index swap (OIS) rates. There was a pronounced V-shaped pattern in global equity markets, with the euro area equity index ending the review period broadly unchanged despite significant fluctuations. Euro area corporate bond spreads widened for both investment-grade and, particularly, high-yield issuers. In the foreign exchange market, the euro appreciated significantly both against the US dollar (5.4%) and in trade-weighted terms (2.5%).
During the review period, euro area risk-free rates declined significantly as market participants increased their expectations of near-term cuts to the deposit facility rate (Chart 14). The benchmark euro short-term rate (€STR) stood at 2.17% at the end of the review period, following the Governing Council’s widely anticipated decisions to lower the key ECB interest rates by 25 basis points at both its March and April meetings. Excess liquidity decreased by around €117 billion to €2,710 billion. This mainly reflected the decline in the portfolios of securities held for monetary policy purposes, with the Eurosystem no longer reinvesting the principal payments from maturing securities in its asset purchase programmes. After shifting upwards following the announcements made just before the start of the review period of a planned fiscal expansion in Germany and initiatives to boost military spending in the EU (the ReArm Europe Plan), the forward curve gradually reversed a significant proportion of this upward shift on the back of mounting international trade tensions. The US tariff announcement on 2 April 2025 and subsequent escalation of global trade tensions triggered a pronounced downward repricing of the €STR forward curve, reflecting expectations of a faster pace of monetary policy easing in the euro area. The stream of positive tariff-related news – primarily the 90-day suspension of additional US tariffs announced in early April and the agreement of US-UK and US-China tariff deals – brought relief to financial markets. Subsequently, however, further negative trade-related news once again weighed on the interest rate outlook. By the end of the review period, market participants were pricing in cumulative interest rate cuts of nearly 60 basis points by the end of 2025, around 35 basis points more than that priced in at the start of the review period. Longer-term euro area risk-free rates also declined during the review period, albeit to a lesser extent than shorter-term risk-free rates, as the ten-year nominal OIS rate fell by 18 basis points to 2.4% over this period.
Chart 14
€STR forward rates
(percentages per annum)
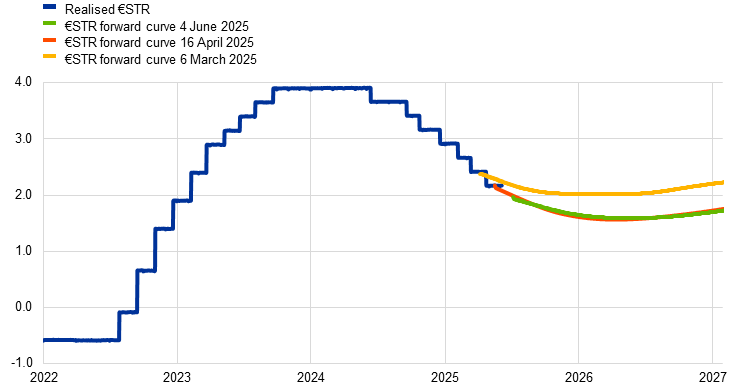
Sources: Bloomberg and ECB calculations.
Note: The forward curve is estimated using spot OIS (€STR) rates.
Long-term sovereign bond yields also declined amid the trade tensions, accompanied by a compression of spreads (Chart 15). The ten-year GDP-weighted euro area sovereign bond yield closed the review period at around 3%, a decline of 36 basis points from its initial level, with spreads relative to the OIS rate narrowing by 19 basis points. There were intermittent fluctuations over the review period, as well as cross-country variations linked to trade developments. Immediately after the initial US tariff announcement on 2 April 2025 and the resulting rise in uncertainty, euro area sovereign bond prices increased, with German bond prices recording notable gains. Meanwhile, US Treasuries (along with the US dollar) came under market pressure amid emerging doubts about their safe haven status and the impact of tariffs on US inflation. Some of these effects have since reversed following the announcement of a 90-day pause on the additional tariffs and the de-escalation of US-China trade tensions, which pushed German bond yields up and narrowed the spreads of higher-yield euro area countries. The ten-year US Treasury yield fluctuated significantly over the review period, ultimately ending at approximately 4.4%, around 13 basis points higher than at the start of the period. This increase in US bond yields was driven by a combination of factors, including, most recently, heightened scrutiny over the country’s rising debt levels and Moody’s recent decision to downgrade its credit rating.
Chart 15
Ten-year sovereign bond yields and the ten-year OIS rate based on the €STR
(percentages per annum)

Sources: LSEG and ECB calculations.
Notes: The vertical grey line denotes the start of the review period on 6 March 2025. The latest observations are for 4 June 2025.
There was a pronounced V-shaped pattern in global equity markets, with the euro area equity index ending the review period broadly unchanged (Chart 16). The German fiscal spending announcement in early March drove a surge in European equity markets. However, the US tariff announcement on 2 April triggered a sharp sell-off in global equity markets, leading to spikes in market volatility. Equity prices across the globe quickly recovered from these US tariff-related losses following the announcement of their 90-day suspension, despite lingering trade uncertainty. Towards the end of May, European equity prices dipped slightly after the US Administration announced plans to impose 50% tariffs on European imports but quickly rebounded as these tariffs were held off until 9 July. Over the review period as a whole, euro area stock market indices were broadly unchanged, with equities declining by 1.4% for non-financial corporations (NFCs) and rising by 3.3% for banks. By contrast, US stock market indices strengthened by approximately 4.4% overall, with gains of 4.9% for banks and 4.8% for NFCs. Nevertheless, uncertainty surrounding trade policies remains a significant source of downside risks for risk asset markets.
Chart 16
Euro area and US equity price indices
(index: 1 January 2020 = 100)
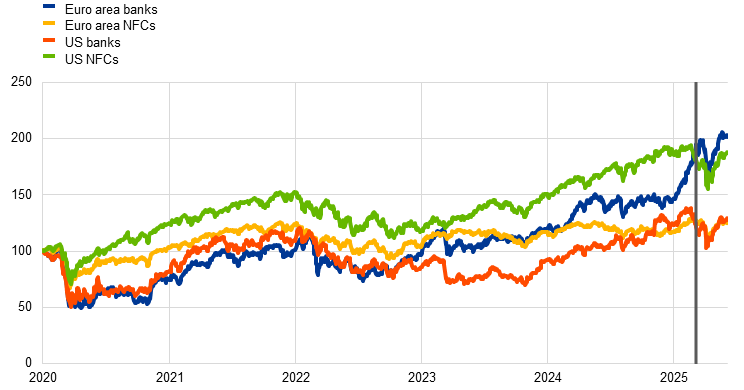
Sources: LSEG and ECB calculations.
Notes: The vertical grey line denotes the start of the review period on 6 March 2025. The latest observations are for 4 June 2025.
Corporate bond spreads widened in both the investment-grade and high-yield segments (Chart 17). Downside risks to the economic outlook weighed on corporate bond markets, particularly following the US tariff announcements in early April 2025. Despite some recent narrowing, spreads in the investment-grade and high-yield segments widened by approximately 13 and 34 basis points respectively over the review period. Within the high-yield segment, spreads on NFC bonds increased by 25 basis points, while spreads on bonds issued by financial corporations widened by around 66 basis points.
Chart 17
Euro area corporate bond spreads
(basis points)

Sources: LSEG and ECB calculations.
Notes: The vertical grey line denotes the start of the review period on 6 March 2025. The latest observations are for 4 June 2025.
In foreign exchange markets, the euro appreciated significantly both against the US dollar and in trade-weighted terms (Chart 18). The nominal effective exchange rate of the euro – as measured against the currencies of 41 of the euro area’s most important trading partners – rose by 2.5% during the review period. This appreciation was broad-based. A strong appreciation of 5.4% against the US dollar was largely driven by a shift in market expectations regarding the growth and inflation outlook for the United States and the potential impact of the US Administration’s policies on demand for US assets, particularly in the aftermath of its tariff announcements in early April. It may also be attributed to more positive investor sentiment towards the euro following Germany’s fiscal spending announcement and the special European Council on strengthening the EU’s defence capabilities in early March. The euro also strengthened by 4.6% against the Chinese renminbi, with the latter initially weakening owing to the expected adverse impact of the US tariffs but recovering somewhat after a partial de-escalation of the US-China trade tensions. The euro appreciated significantly against the currencies of emerging market economies, which were also weighed down by US tariff and global growth concerns. Conversely, it depreciated by 2.0% against the Swiss franc, a traditional safe haven, amid overall cautious market sentiment.
Chart 18
Changes in the exchange rate of the euro vis-à-vis selected currencies
(percentage changes)

Source: ECB calculations.
Notes: EER-41 is the nominal effective exchange rate of the euro against the currencies of 41 of the euro area’s most important trading partners. A positive (negative) change corresponds to an appreciation (depreciation) of the euro. All changes have been calculated using the foreign exchange rates prevailing on 4 June 2025.
5 Financing conditions and credit developments
In April, bank funding costs continued to fall, reflecting lower policy rates. Average interest rates on new loans to firms declined in April to 3.8%, whereas average interest rates for households on new mortgages remained at 3.3%. The disparity between lending rates for households and those for firms reflects differences in loan fixation periods. Growth in loans to firms and households continued to recover gradually in April but remained far below historical averages, reflecting a weak macroeconomic outlook and high uncertainty. Over the review period from 6 March to 4 June 2025, the cost to firms of equity financing rose slightly, owing to the somewhat higher equity risk premium, while the cost of market-based debt financing decreased marginally. The annual growth rate of broad money (M3) increased to 3.9% in April.
Bank funding costs continued to fall in April 2025. The composite cost of debt financing for euro area banks, i.e. the index which measures marginal bank funding costs, moderated further in April (Chart 19, panel a), reflecting the ECB’s policy rate cuts, whereas the overall decline in average bank funding costs was more modest over the course of the month. Deposit rates and interbank money market rates continued to fall, with the composite deposit rate standing at 1.0% in April, down from its peak of 1.4% in May 2024. Bank bond yields remained broadly stable in March and April 2025 and edged down in May, despite heightened volatility in financial markets at the beginning of the month which was partly related to recent US tariff announcements (Chart 19, panel b). As in previous months, interest rates on the time deposits of firms and households fell more sharply than those on overnight deposits, narrowing the significant gap between interest rates on time deposits and those on overnight deposits for both firms and households.
Chart 19
Composite bank funding costs in selected euro area countries
(annual percentages)
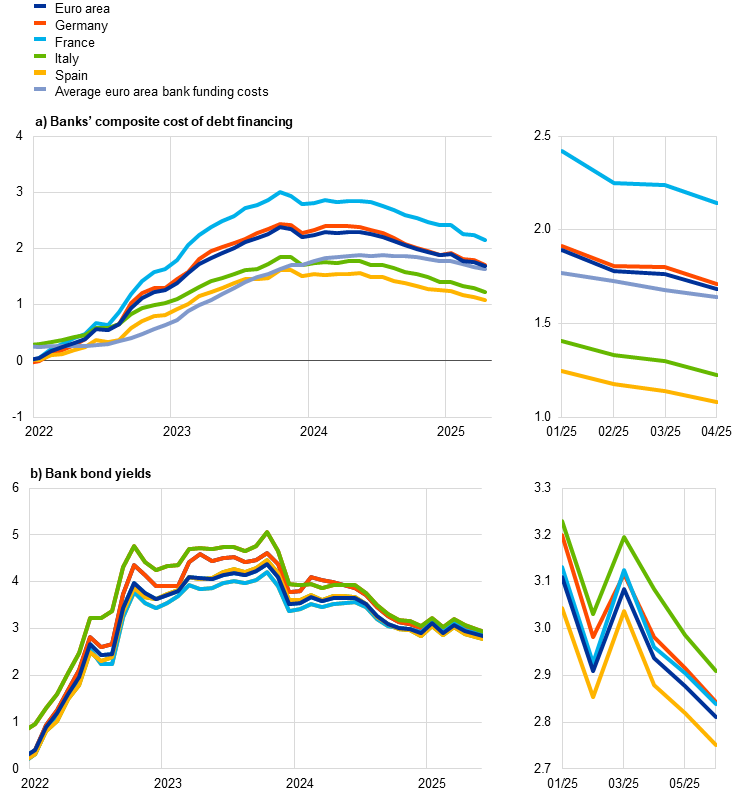
Sources: ECB, S&P Dow Jones Indices LLC and/or its affiliates, and ECB calculations.
Notes: Composite bank funding costs are an average of new business costs for overnight deposits, deposits redeemable at notice, time deposits, bonds and interbank borrowing, weighted by their respective outstanding amounts. Average bank funding costs use the same weightings but are based on rates for outstanding deposits and interbank funding, and on yield to maturity at issuance for bonds. Bank bond yields are monthly averages for senior tranche bonds. The latest observations are for April 2025 for the composite cost of debt financing for banks (panel a) and for 4 June 2025 for bank bond yields (panel b).
Bank lending rates for firms continued to decline while mortgage rates for households remained broadly stable, reflecting differences in loan fixation periods. In April 2025, lending rates for new loans to non-financial corporations (NFCs) fell by 14 basis points to stand at 3.79%, a decline of around 1.5 percentage points from their October 2023 peak (Chart 20, panel a). This decline was broad-based across the largest euro area countries and was driven by short-term loans with a maturity of up to one year. By contrast, lending rates on loans with longer maturities remained broadly unchanged, reflecting higher longer-term risk-free rates. The spread between interest rates on small and large loans to firms remained stable in April at 46 basis points, slightly above its historical low and with some variation across countries. For households, lending rates on new loans for house purchase fell by 5 basis points to stand at 3.27% in April, around 80 basis points below their November 2023 peak, albeit with some variation across countries (Chart 20, panel b). That said, mortgage rates on purely new loans, i.e. excluding renegotiations, remained broadly stable. The disparity between lending rates for households and those for firms reflects differences in loan fixation periods. Household loans typically have longer fixation periods, making them less sensitive to short-term market rate fluctuations.
Chart 20
Composite bank lending rates for firms and households in selected euro area countries
(annual percentages)
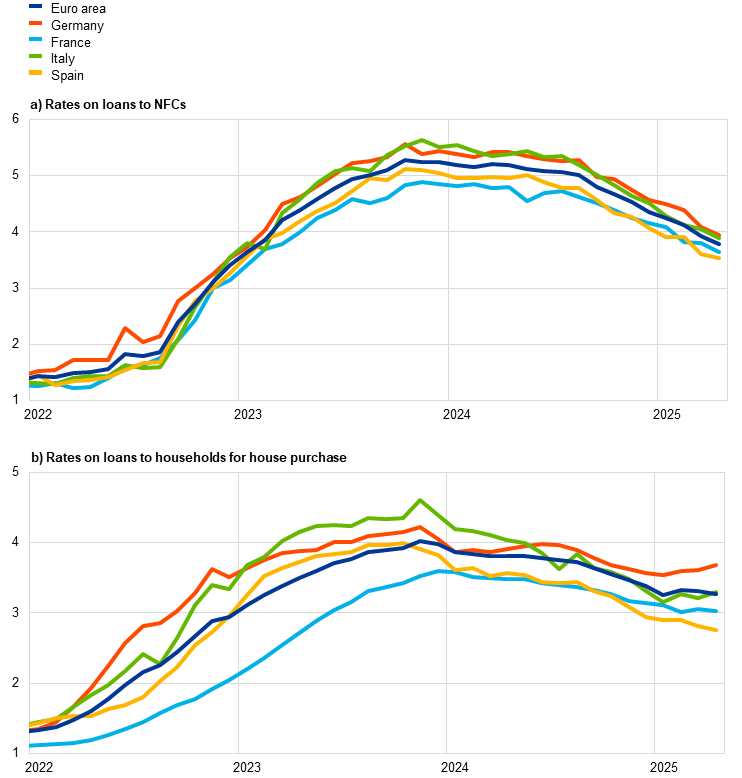
Sources: ECB and ECB calculations.
Notes: NFCs stands for non-financial corporations. Composite bank lending rates are calculated by aggregating short and long-term rates using a 24-month moving average of new business volumes. The latest observations are for April 2025.
Over the review period from 6 March to 4 June 2025, the cost to firms of equity financing rose slightly, whereas the cost of market-based debt financing decreased marginally. Based on the monthly data available until April 2025, the overall cost of financing for NFCs – i.e. the composite cost of bank borrowing, market-based debt and equity – increased in April compared with the previous month and stood at 5.9% (Chart 21).[12] This was the result of an increase in the cost of equity owing to a somewhat higher equity risk premium. All other cost components either declined or remained unchanged. Daily data covering the review period up to 4 June 2025 show that the cost of market-based debt financing further decreased marginally. This was driven by a downward shift in the overnight index swap (OIS) curve across all maturities, which was only partially offset by the widening of corporate bond spreads, particularly on bonds in the high-yield sector. The cost of equity financing rose slightly over the same period in response to a small increase in the equity risk premium, despite the decline in the long-term risk-free rate, as approximated by the ten-year OIS rate.
Chart 21
Nominal cost of external financing for euro area firms, broken down by component
(annual percentages)
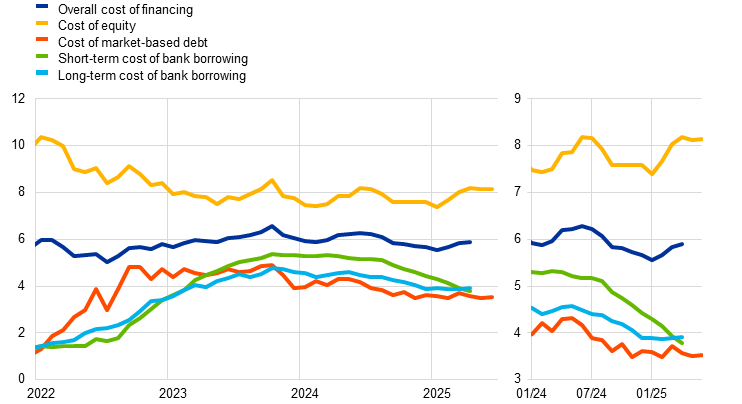
Sources: ECB, Eurostat, Dealogic, Merrill Lynch, Bloomberg, LSEG and ECB calculations.
Notes: The overall cost of financing for non-financial corporations (NFCs) is based on monthly data and is calculated as a weighted average of the long and short-term costs of bank borrowing (monthly average data), market-based debt and equity (end-of-month data), based on their respective outstanding amounts. The latest observations are for 4 June 2025 for the cost of market-based debt and the cost of equity (daily data), and for April 2025 for the overall cost of financing and the cost of borrowing from banks (monthly data).
Growth in loans to firms and households continued to increase gradually in April, reflecting weaker short-term dynamics. The annual growth rate of bank lending to firms rose to 2.6% in April 2025, up from 2.4% in March, but remained well below its historical average of 4.3% since January 1999 (Chart 22, panel a). By contrast, the annual growth rate of corporate debt securities decreased to 2.1% in April, from 3.0% in March, contributing to a slight weakening in the growth of firms’ total debt financing. Meanwhile, the annual growth rate of loans to households continued to increase gradually, reaching 1.9% in April, after 1.7% in March. However, this growth rate of loans to households has lost its momentum, remaining significantly below its historical average of 4.1% (Chart 22, panel b). Loans for house purchases continued to be the primary driving force behind this upward trend, with consumer credit also seeing a modest rise and an annual growth rate of 4.3% in April, despite signs of weakening short-term dynamics.[13] By contrast, other forms of household lending, including loans to sole proprietors, remained weak. Household sentiment regarding credit access deteriorated sharply in April. According to the ECB’s Consumer Expectations Survey for April, the percentage of households perceiving tighter credit access increased, surpassing the percentage reporting easier credit access, marking the largest monthly increase on record. Looking ahead, households expect credit access to tighten further over the next 12 months.
Chart 22
MFI loans in selected euro area countries
(annual percentage changes)

Sources: ECB and ECB calculations.
Notes: Loans from monetary financial institutions (MFIs) are adjusted for loan sales and securitisation; in the case of non-financial corporations (NFCs), loans are also adjusted for notional cash pooling. The latest observations are for April 2025.
Growth in broad money (M3) picked up in April 2025, driven by overnight deposits and inflows from abroad in a context of high uncertainty (Chart 23). Annual M3 growth rose to 3.9% in April, up from 3.7% in March, supported by a moderately strong monthly inflow over the course of the month. Annual growth of narrow money (M1), which comprises the most liquid assets of M3, increased significantly to 4.7% in April, up from 3.9% in March. With regard to the individual components, the increase in M3 in April was driven by inflows into overnight deposits and, to a lesser extent, by repurchase agreements held by firms and institutional investors. The annual growth rate of overnight deposits held by firms and households rose to 5.3% in April, up from 4.1% in March, reflecting a strong preference for liquidity by investors amid volatility in an uncertain environment and lower interest rates on savings deposits. This partly offset the weakening in time deposits, explaining the contrasting dynamics in M1 and M3. With regard to the various counterparts, the recovery in M3 growth was driven by net foreign inflows. However, the figure for April was overestimated because of special factors – unrelated to US tariff announcements – which had boosted government deposits, with the underlying inflows likely to have been more moderate. Bank lending to firms and households continued to contribute positively to money creation in April. While the ongoing contraction of the Eurosystem balance sheet continued to contribute negatively to M3 growth, robust net purchases of government securities by banks helped to offset this impact.
Chart 23
M3, M1 and overnight deposits
(annual percentage changes, adjusted for seasonal and calendar effects)

Source: ECB.
Note: The latest observations are for April 2025.
6 Fiscal developments
According to the June 2025 Eurosystem staff macroeconomic projections for the euro area, the general government budget deficit, which stood at 3.1% of GDP in 2024, is estimated to remain unchanged in 2025 and then increase substantially to 3.5% of GDP in 2027. The euro area fiscal stance is projected to tighten only slightly in 2025, loosen noticeably in 2026 and then tighten again, somewhat more strongly, in 2027. The projected loosening in 2026 is mainly on account of higher public investment and consumption, partly related to increased defence and infrastructure spending, as well as lower direct taxation. The tightening in 2027 reflects primarily lower assumed government spending related to the discontinuation of the grants offered under the Next Generation EU (NGEU) programme. The euro area debt-to-GDP ratio is seen as being on an increasing path, to over 90% of GDP, as the continuous primary deficits and positive deficit-debt adjustments more than offset favourable interest rate-growth differentials. Currently 11 euro area countries have decided to request the activation of the national escape clause of the Stability and Growth Pact (SGP) in order to facilitate higher defence spending.
According to the June 2025 Eurosystem staff macroeconomic projections, the euro area general government budget balance is expected to decline over the projection horizon (Chart 24).[14] Looking back, the euro area budget deficit declined from 3.5% in 2023 to 3.1% of GDP in 2024. This was due to the unwinding of most of the remaining energy and inflation-related fiscal support measures. Looking ahead, it is expected to remain unchanged in 2025 and then increase to 3.4% of GDP in 2026 and further to 3.5% of GDP in 2027. This path mainly reflects the projected evolution of the fiscal stance – as measured by the cyclically adjusted primary balance adjusted for NGEU grants – and, in 2027, the discontinuation of grants offered under the NGEU programme, which ends in 2026.[15] The cyclical component of the budget balance, which reflects output gap developments, is projected to be broadly neutral over the projection horizon.
Chart 24
Budget balance and its components
(percentages of GDP)
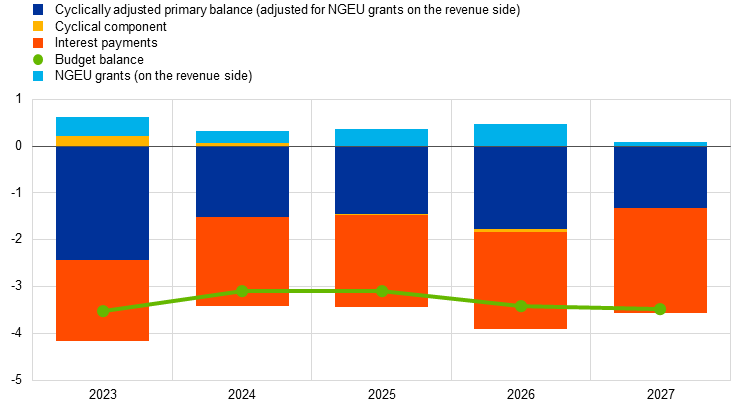
Sources: ECB calculations and Eurosystem staff macroeconomic projections for the euro area, June 2025.
The budget deficit in 2024 turned out to be 0.1 percentage points lower in the June 2025 projections than estimated in the March 2025 ECB staff macroeconomic projections for the euro area, but has been revised upwards over the projection horizon. This surprise was driven mainly by higher than initially anticipated direct tax revenues and social contributions at the euro area level. Despite this slightly better starting position, the budget balance has been revised down by 0.1 percentage points of GDP in 2026 and by 0.2 percentage points of GDP in 2027. This loosening is due mostly to fiscal policy measures in Germany, endorsed by the Coalition Agreement and related to higher defence and infrastructure spending, particularly in the period 2026-27. Other contributing factors to the deterioration in the budget balance include Germany’s ongoing provision of support to Ukraine and reductions in direct and indirect taxes, as well as, to some extent, higher projected defence spending and support to Ukraine in several other euro area countries.
Following a significant tightening in 2024, the euro area aggregate fiscal stance is projected to tighten only slightly in 2025, loosen markedly in 2026 and then tighten again, somewhat more strongly, in 2027. The considerable fiscal tightening of 0.9 percentage points in 2024 resulted mainly from the withdrawal of most of the energy and inflation-related support and other fiscal stimulus measures that had been implemented during earlier crises. In 2025 discretionary fiscal policy measures are translating into ongoing fiscal tightening, albeit at a slower pace. This reflects increases in social security contributions and indirect taxes, which are nevertheless being largely offset by continued public spending growth. In 2026 the fiscal stance is projected to loosen based on recent government announcements, mainly on account of higher public investment and consumption, partly related to increased defence and infrastructure spending, as well as lower direct taxation. In 2027 the tightening in the fiscal stance primarily reflects lower government spending following the expiry of the NGEU grant funding.
The euro area debt-to-GDP ratio is seen as being on an increasing path over the projection horizon, rising to above 90% of GDP in 2027 (Chart 25). During the COVID-19 pandemic, the euro area debt-to-GDP ratio rose significantly, to around 97% in 2020, but fell gradually thereafter. However, since 2023 it has been following an upward trend, reaching 87.5% in 2024, with the lowest debt-to-GDP ratio in Estonia (23.6%) and the highest in Greece (153.6%). It is projected to increase further to 90.3% in 2027, driven by primary deficits and, in some countries, sizeable deficit-debt adjustments.
Chart 25
Drivers of change in euro area government debt
(percentages of GDP, unless otherwise indicated)
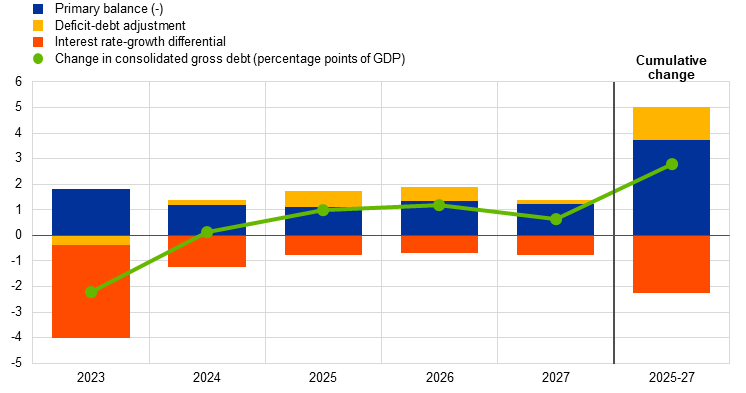
Sources: ECB calculations and Eurosystem staff macroeconomic projections for the euro area, June 2025.
Currently 11 euro area countries have decided to request the activation of the SGP’s national escape clause to finance expenditure on defence. The activation of the national escape clause is part of the ReArm Europe Plan/Readiness 2030 package, which allows EU Member States to quickly and significantly boost their defence spending by a maximum of 1.5% of GDP over a period of four years. It should not have any other impact on countries’ medium-term fiscal-structural plans for 2025-28 and rests on the premise that fiscal sustainability over the medium term is safeguarded.[16] The European Commission, as part of its 2025 European Semester Spring Package released on 4 June, recommends that the Council approve the requests of ten euro area countries to activate the escape clause (Belgium, Estonia, Greece, Croatia, Latvia, Lithuania, Portugal, Slovenia, Slovakia and Finland).[17] Governments should ensure sustainable public finances in line with the EU’s economic governance framework, while prioritising essential growth-enhancing structural reforms and strategic investment.
Boxes
1 US financial conditions and their link to economic activity: the role of equity valuations
Financial conditions matter for economic activity and inflation. Financial conditions indices (FCIs) provide a consolidated measure of how easily and cheaply households, firms and governments can access financing, which in turn influences spending and investment decisions across the economy. Various FCIs have been proposed by practitioners and scholars. These differ in specification and scope, but typically include key financial variables such as interest rates, equity prices, corporate bond spreads and exchange rates.[18] Central banks, for instance, examine FCIs because these offer insights into how monetary policy decisions affect financial markets and, by extension, economic activity and inflation.
More2 US trade policies and the activity of US multinational enterprises in the euro area
Affiliates of multinational enterprises (MNEs) headquartered in the United States contribute substantially to euro area economic activity. Hence, ongoing trade tensions have potentially important implications for their operations. US MNEs serve the euro area market either by exporting goods and services directly to euro area customers or via affiliates located in the euro area.[19] These affiliates may trade with the United States and third markets, so ongoing trade tensions could affect US MNEs in the euro area via higher tariffs and disruptions to intra-firm trade, as well as via any resulting changes in tax planning strategies. Euro area affiliates of US MNEs account for over 5% of euro area value added, gross operating surplus and purchases of goods and services, and 2% of persons employed, with substantially higher shares for Ireland (Chart A).[20]
More3 The outlook for euro area business investment – findings from an ECB survey of large firms
This box summarises the findings of a recent ECB survey of leading non-financial companies on the outlook for business investment.[21] The survey, carried out between 7 April and 14 May, asked firms about recent and expected euro area and global investment decisions and the factors driving or constraining these. Responses were received from 64 companies with an aggregate global revenue equivalent to almost 4% of euro area GDP. Of these, 39 are mainly active in the industrial sector, while the other 25 focus primarily on services.
More4 Where do we stand with inflationary pressures arising from price resetting?
The disinflation in euro area services has been slower than that of the overall headline Harmonised Index of Consumer Prices (HICP) (Chart A). This is can be attributed to a combination of factors: a delayed response to the general inflation surge by some services prices, elevated wage pressures and strong demand for services (especially recreation services).[22] This box focuses on the first factor and examines the role of the services items in the HICP basket that tend to be repriced less frequently and thus may still push up price pressures while other items are already experiencing disinflation.
More5 Financial market volatility and economic policy uncertainty: bridging the gap
Following the 2 April tariff announcement by the US Administration, financial market volatility spiked from previously subdued levels, becoming more aligned with the surge in economic policy uncertainty (EPU) observed since the autumn of last year. Chart A illustrates financial market volatility measures for the euro area (VSTOXX) and the United States (VIX) alongside the corresponding EPU indices. EPU indices are news-based measures of economic policy uncertainty that have gained in popularity for their ability to track major economic and political events.[23] Since last autumn, EPU indices have surged on both sides of the Atlantic, with this upward trend continuing into 2025 amid enduring geopolitical risk and increasing uncertainty surrounding tariff policies. In contrast, financial market volatility in both the euro area and the United States remained relatively muted until March on the back of strong momentum in equity markets. However, both the VIX and the VSTOXX spiked following the equity market sell-off triggered by the announcement of US tariffs on 2 April.
More6 Determinants of inflation expectations of firms in the SAFE
This box looks at the formation of the euro area inflation expectations captured in the survey on access to finance of enterprises (SAFE). Since June 2023 the SAFE has collected information on euro area inflation expectations for one-year, three-year and five-year horizons.[24] Since March 2024 it has also covered firms’ perceived uncertainty about their five-year inflation expectations.
More7 Liquidity conditions and monetary policy operations from 5 February to 22 April 2025
This box describes the Eurosystem liquidity conditions and monetary policy operations in the first and second reserve maintenance periods of 2025. Together, these two maintenance periods ran from 5 February to 22 April 2025 (the “review period”).
MoreArticles
1 The transmission of monetary policy: from mortgage rates to consumption
Monetary policy affects consumption via multiple channels, with different effects on households’ decisions. By preserving price stability, monetary policy supports consumption in the medium run, as it protects the purchasing power of households. In the short run, however, tighter monetary policy typically dampens private consumption.[25] First, higher interest rates reduce current consumption, as they increase the attractiveness of savings via the “intertemporal substitution channel”. Consumption decisions also respond to changes in policy rates as they affect the prices of financial and real assets and generate wealth effects (the balance sheet channel of monetary policy). In parallel, interest rate changes affect the real economy and the evolving labour market conditions, thereby changing income prospects, with consequences for households’ consumption decisions. Monetary policy also affects household finances via its impact on cash flows from household debts and assets. Higher interest rates raise interest payments by indebted households, reducing the cash flow available for spending, while increasing the interest revenues on interest-bearing assets, raising the cash flow for asset holders. Given these two counteracting forces, the size and sign of the overall cash flow effects for any individual household depend on their net interest rate position.[26] This mechanism is referred to as the cash flow channel of monetary policy.
More2 Advancing the capital markets union in Europe: a roadmap for harmonising securities post-trading
Post-trading is a crucial part of how European capital markets operate. After a trade is made, several important steps follow. These steps involve moving the ownership of financial products, such as bonds, from the seller to the buyer and handling the assets used as security in financial transactions. For example, a bank wishing to borrow money from a central bank needs to provide some of its eligible assets as collateral, akin to a buyer using a house as collateral for a mortgage. Post-trading needs to ensure these processes happen smoothly and securely.[27] Safe and efficient post-trading is the foundation for well-functioning capital markets, supporting their attractiveness and lowering the costs of savings and investments.
MoreStatistics
https://www.ecb.europa.eu/pub/pdf/ecbu/ecb.eb_annex202504~744ae4d7c8.en.pdf© European Central Bank, 2025
Postal address 60640 Frankfurt am Main, Germany
Telephone +49 69 1344 0
Website www.ecb.europa.eu
All rights reserved. Reproduction for educational and non-commercial purposes is permitted provided that the source is acknowledged.
For specific terminology please refer to the ECB glossary (available in English only).
The cut-off date for the statistics included in this issue was 4 June 2025.
PDF ISSN 2363-3417, QB-01-25-071-EN-N
HTML ISSN 2363-3417, QB-01-25-071-EN-Q
References to world and/or global aggregates of economic indicators throughout this section exclude the euro area.
For further details, see “Eurosystem staff macroeconomic projections for the euro area, June 2025”, published on the ECB’s website on 5 June 2025.
ECB staff projections include a broader set of countries, notably large emerging markets (e.g. China, India, Brazil and Russia), which are not accounted for in OECD CPI inflation.
Quarterly euro area real GDP growth was revised up to 0.6% in the data release on 6 June, two days after the cut-off date for the data in this issue of the Economic Bulletin.
For more information, see the “Eurosystem staff macroeconomic projections for the euro area, June 2025”, published on the ECB’s website.
Quarterly euro area employment growth was revised down to 0.2% in the data release on 6 June, two days after the cut-off date for the data in this issue of the Economic Bulletin.
National accounts data, published on 6 June following the Governing Council meeting, show steady growth in non-construction investment of 0.7% (excluding Irish intangibles), quarter on quarter, in the first quarter of 2025, in line with the fourth quarter of 2024.
For more information, see “Summary of the Non-Financial Business Sector Dialogue on 14 May 2025 via videoconference”, ECB, 2025.
See “Eurosystem staff macroeconomic projections for the euro area, June 2025”, published on the ECB’s website on 5 June 2025.
For further details on the projections under alternative trade policy scenarios, see Box 2 entitled “US tariffs and trade policy uncertainty”, Eurosystem staff macroeconomic projections for the euro area, June 2025.
April 2025 is the latest month for which all indicators are available.
Owing to lags in data availability for the cost of borrowing from banks, data on the overall cost of financing for NFCs are only available up to April 2025.
Simulations using the current distribution of loans across households indicate that, despite recent interest rate cuts, a significant portion of the past monetary tightening is still in the pipeline. Estimates suggest that up to 35% of the total impact on consumption through the mortgage cash flow channel has yet to materialise. For further details, see the article entitled “The transmission of monetary policy: from mortgage rates to consumption” in this issue of the Economic Bulletin.
See “Eurosystem staff macroeconomic projections for the euro area”, June 2025, published on the ECB’s website on 5 June 2025.
The fiscal stance reflects the direction and size of the stimulus from fiscal policies to the economy beyond the automatic reaction of public finances to the business cycle. It is measured here as the change in the cyclically adjusted primary balance ratio net of government support to the financial sector. Given that the higher budget revenues related to NGEU grants from the EU budget do not have a contractionary impact on demand, the cyclically adjusted primary balance is adjusted to exclude those revenues. For more details on the euro area fiscal stance, see the article entitled “The euro area fiscal stance”, Economic Bulletin, Issue 4, ECB, 2016.
See the article entitled “Medium-term fiscal-structural plans under the revised Stability and Growth Pact”, Economic Bulletin, Issue 3, ECB, 2025.
The Recommendations on activating the national escape clause are available on the European Commission’s website. Although the EU Council and the European Commission have received a request from Germany to activate the national escape clause, Germany has not yet submitted its medium-term fiscal-structural plan. The Commission will therefore assess the request together with the medium-term fiscal-structural plan upon receipt.
See, among others, Davis, E.P. et al., “The Estimation of Financial Conditions Indices for the Major OECD Countries”, OECD Economics Department Working Papers, 1335, OECD Publishing, 2016; International Monetary Fund, Global Financial Stability Report, Chapter 3, April 2017; Goldman Sachs, “Financial conditions: A unified approach”, Research Note, 2016; and Arrigoni, S. et al., “The simpler, the better: Measuring financial conditions for monetary policy and financial stability”, Working Paper Series, No 2451, ECB, 2021.
A multinational enterprise (MNE) is composed of a parent entity and its foreign affiliates. The latter are enterprises resident in one country that are controlled and/or owned by MNEs residing in another country.
For additional information on the impact of US MNEs in Ireland, see Irish Economic Analysis Division, “Geoeconomic risks to the outlook: The possible impact of escalating trade tensions, alternative tariff and tax regimes on the Irish economy”, Quarterly Bulletin, Issue 4, Central Bank of Ireland, December 2024.
The survey was sent to firms with which the ECB maintains regular contacts for the purpose of gathering business intelligence, as explained in the article entitled “The ECB’s dialogue with non-financial companies”, Economic Bulletin, Issue 1, ECB, 2021.
For information on the role of energy and wage input costs for services prices, see the box entitled “Decomposing HICPX inflation into energy-sensitive and wage-sensitive items”, Economic Bulletin, Issue 3, ECB, 2024.
For more on the EPU methodology, see Baker, S.R., Bloom, N. and Davis, S.J., “Measuring Economic Policy Uncertainty”, The Quarterly Journal of Economics, Vol. 131, No 4, November 2016, pp. 1593-1636.
For more information on the SAFE, see the article entitled “The Survey on the Access to Finance of Enterprises: monetary policy, economic and financing conditions and inflation expectations”, Economic Bulletin, Issue 7, ECB, 2024. Following two pilot rounds, the SAFE became quarterly in March 2024.
See, for example, Peersman, G. and Smets, F., “The monetary transmission mechanism in the euro area: evidence from VAR analysis”, in Angeloni, I., Kashyap, A.K. and Mojon, B. (eds.), Monetary Policy Transmission in the Euro Area, Cambridge University Press, Cambridge, 2003.
Auclert, A., “Monetary Policy and the Redistribution Channel”, American Economic Review, Vol. 109, No 6, 2019, pp. 2333-67.
Post-trading activities are the steps taken after a trade is executed to ensure its successful completion. These include: (i) clearing, which is the process of reconciling purchase and sales orders, ensuring that both parties have the necessary funds and securities to complete the trade; (ii) settlement, which involves the actual exchange of securities and payment between the buyer and seller, finalising the transfer of ownership; (iii) custody and asset servicing, which involves the safekeeping of securities, along with managing corporate actions such as dividends, interest payments and other events affecting the securities; and (iv) reporting, which involves documenting and communicating the details of the trade to the relevant parties and regulatory bodies to ensure transparency and compliance with regulations.