Introducing the Distributional Wealth Accounts for euro area households
Published as part of the ECB Economic Bulletin, Issue 5/2024.
1 Introduction
This article introduces the euro area Distributional Wealth Accounts (DWA), a dataset developed by the European System of Central Banks (ESCB) which provides new experimental statistics on household wealth. The DWA data complement traditional macroeconomic national accounts and household surveys by providing information on household wealth that is consistent with the macroeconomic Quarterly Sectoral Accounts (QSA).[1] The DWA aim to meet the growing interest in understanding wealth distribution dynamics in the euro area and across euro area countries.[2]
The DWA are of particular interest to central banks, facilitating the analysis of the distributional wealth effects of inflationary and monetary policy shocks. The DWA also support the ECB’s monetary policy strategy, which aims to include a systematic assessment of the two-way interaction between income and wealth distributions and monetary policy.[3] Households differ significantly in their levels of wealth and its composition, and in the sensitivity of their income to economic shocks. Therefore, the distributions of wealth and income play a key role in shaping the transmission of monetary policy to economic activity and inflation. At the same time, monetary policy may have heterogenous distributional effects.[4]
This article explores the main features of the DWA and illustrates how the dataset can be used to analyse the distributional effects of macroeconomic shocks, including monetary policy. Section 2 describes the methodology used to compile the DWA, discussing data sources, estimation techniques and data availability. Section 3 presents evidence on the key features of the dataset, documenting the dynamics of the wealth distribution and wealth components over time at the euro area level and across countries. Section 4 discusses how changes in asset prices affect household wealth across the distribution depending on the composition of assets and liabilities and explores the implications of asset prices for wealth inequality. Section 5 assesses the effects of rising inflation and subsequent monetary policy tightening across the wealth distribution, and their impact on inequality. Section 6 concludes.
2 The DWA methodology
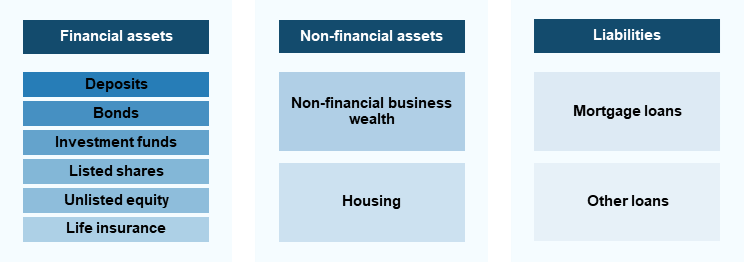
The DWA provide timely quarterly distributional information on wealth, aligned with the macroeconomic aggregates. The DWA include data on household net wealth and on financial and non-financial assets and liabilities and their components (Figure 1). Households are broken down into the top five deciles of net wealth and the bottom 50%, as well as by employment and housing status. The DWA also provide inequality indicators such as the Gini coefficient, share of net wealth held by the top 5%, 10% and bottom 50%, mean and median net wealth, and debt-to-asset ratios by net wealth decile. Data are available for the euro area as a whole, and for all euro area countries except Croatia, as well as for Hungary. Time series for the euro area are available from the first quarter of 2009, whereas the starting date for the DWA country data varies depending on the availability of the distributional source data. Data are compiled every quarter and published five months after the end of each reference quarter.
Figure 1
Main DWA features: components of assets and liabilities
Source: ECB.
The DWA are constructed by linking household-level information from the ECB’s Household Finance and Consumption Survey (HFCS) to the macroeconomic QSA, thus complementing the two sources (Figure 2). Macroeconomic data show financial and non-financial transactions and positions for the household sector. The time series start in 1999 and cover the last reference quarter with a lag of around three to four months. They follow the methodology of the European System of Accounts (ESA 2010). By contrast, HFCS data provide information on the distribution of wealth among euro area households.[5] Four waves of the survey have been released, approximating to the years 2010, 2013, 2017 and 2021. These data are published with a lag of around 18 months.
The DWA leverage on the advantages of sector accounts and household survey data. Sector accounts are frequent, timely and exhaustive, but lack distributional information. Household surveys are rich in terms of distributional information but are impaired by infrequent updates, longer publication delays and incomplete wealth coverage. The DWA bridges these gaps by offering data consistent with national accounts, adhering to international standards, and providing quarterly updates with timely distributional insights akin to household surveys. Developed by experts from the ESCB, the DWA ensure harmonised compilation of country-level data and euro area aggregates.
Figure 2
Main DWA features: linking micro and macro data on wealth

Source: ECB.
The challenge for the DWA is to reconcile the HFCS and the QSA to the full extent possible, using the national accounts concepts and the aggregated results of the QSA as a benchmark. The methodology used to bridge household surveys and sector accounts consists of a series of steps. First, to cover as much common ground as possible between the HFCS and the QSA, a wealth concept specific to the DWA is defined and individual items from both the HFCS and the QSA are adjusted accordingly. At the euro area level, this common ground captures around 90% of household assets and liabilities as recorded in the wealth concept of the national accounts, while a few items (e.g. currency (cash), pension entitlements) are currently not included in the DWA owing to constraints in the availability of data. Work is currently under way to cover these items.[6] Then, for each HFCS release, the QSA data closest in time are matched and the population scope in the HFCS is scaled up to match that of the QSA. Deposits, which tend to be considerably lower in the HFCS than those reported in the QSA, are adjusted at this point in order to accommodate some survey results identified as outliers. Furthermore, because households at the top of the wealth distribution (“rich households”) are difficult to capture in surveys, a crucial step in the DWA process involves estimating rich households that are under-represented in survey results. Any gaps still remaining between the HFCS, adjusted up to this point, and the QSA are allocated proportionately across households for each item in the wealth concept.[7]
Quarterly DWA data are produced by interpolating and extrapolating information from the HFCS waves and combining it with aggregate quarterly changes in the components of wealth as reported in the QSA. The latest DWA quarters after the most recent HFCS wave are extrapolated under the assumption that the distribution of each individual instrument has remained stable. However, DWA distributions of net wealth change in the extrapolation period in line with the trends in the underlying QSA totals for the instruments and the holdings of different household groups. For example, strong increases in share prices will tend to shift the wealth distribution towards those household groups which typically hold shares as part of their financial investments. The DWA capture those effects.
Sensitivity analysis has shown that the DWA are sufficiently reliable for analytical and policy use while involving assumptions and estimates, meaning that data are labelled “experimental”. For example, assumptions are used for the distribution of deposits and calculation of time series. At the same time, additional information, generally based on media sources, is used when estimating the wealth of the richest households.[8]
3 Key stylised facts in the DWA dataset
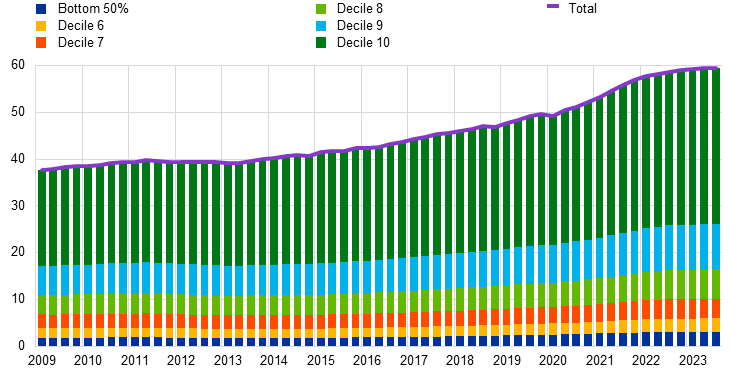
The distribution of household wealth is highly uneven, with rich households owning a large share of the total (Chart 1, panel a).[9] In the euro area, for example, the wealthiest 10% of households hold 56% of net wealth, while the bottom 50% hold only 5%. The uneven distribution implies that, based on wealth, a large share of households that matter more for aggregate income, employment and consumption are under-represented and therefore may be less sensitive to wealth effects.
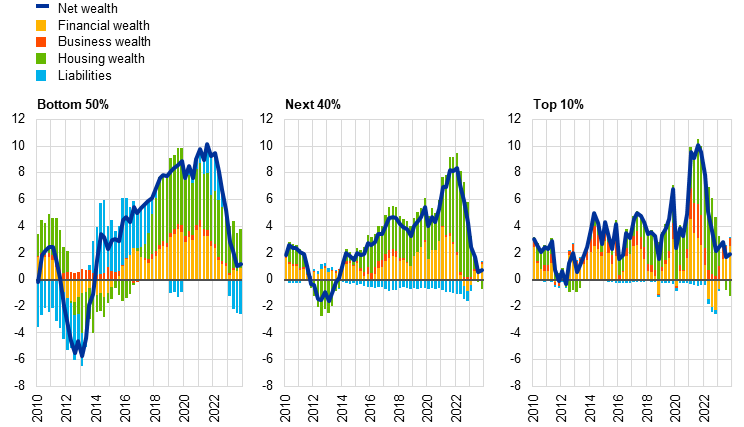
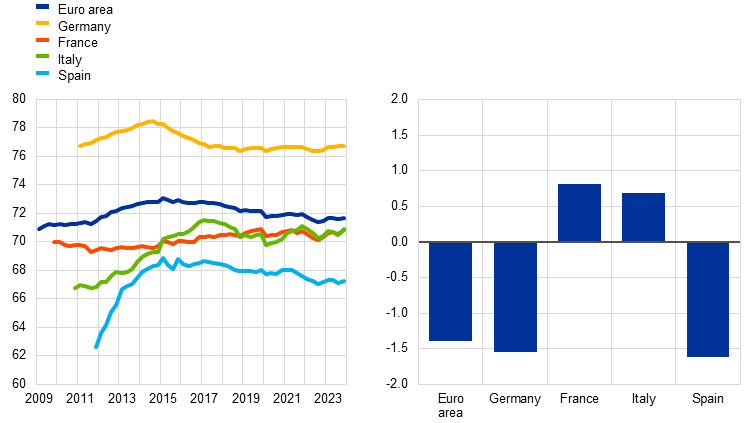
The bottom half of the distribution has witnessed a faster recovery in household net wealth following the losses during the sovereign debt crisis, leading to a decline in wealth concentration since around 2015. The bottom 50% of the net wealth distribution had experienced strong losses in net wealth during the sovereign debt crisis, as their higher indebtedness exacerbated the negative wealth effects induced by the housing market correction in several countries. Since around 2015, these households have been able to recoup losses at a faster pace, albeit from a much lower base, compared with the 40% just above the median and the wealthiest 10% (Chart 1, panel b). For the bottom half, the annual nominal growth rate of wealth consistently exceeded 4% over this period, before slowing down in recent quarters. Wealth accumulation for the bottom half was supported by relatively faster increases in the value of financial and housing assets − with the latter driven by house price appreciation − and by household deleveraging, thereby reducing debt burdens and strengthening balance sheets. Altogether, these developments have contributed to a slight decrease in the Gini coefficient for the euro area by around 1.5 percentage points since 2015 (Chart 1, panel c).[10] Wealth inequality declined further in recent years in the context of the coronavirus (COVID-19) pandemic, the unanticipated surge in inflation and the subsequent monetary policy tightening (see also Sections 4 and 5).
Chart 1
Developments in euro area wealth distribution
a) Household net wealth by wealth group
(EUR trillions)
b) Nominal growth in net wealth and contributions
(annual percentage changes; percentage point contributions)
c) Gini coefficient: level and changes since 2015
(left chart: percentages; right chart: percentage point changes)
Sources: ECB (DWA) and ECB calculations.
Notes: The starting dates of the DWA differ across countries, consistent with the country-specific HFCS waves. In panel b) and throughout the article, housing wealth in the euro area refers to real estate assets; business wealth is the sum of non-financial business wealth and unlisted equity; financial wealth refers to the sum of all other assets; and liabilities refer to the sum of mortgages and other debt. The latest observations for panels a), b) and c) are for the fourth quarter of 2023. The right chart in panel c) shows percentage point changes in the Gini coefficient from the first quarter or 2015 (peak for the euro area) to the fourth quarter of 2023.
Across countries, differences in wealth inequality remain substantial.[11] This reflects structural factors, such as aggregate homeownership rates, which are negatively correlated with inequality, as low homeownership rates tend to imply that a large share of households in the bottom half of the wealth distribution hold very low amounts of wealth.[12] Consistent with this, inequality across the four largest euro area countries is higher in Germany and lower in Spain. Despite such structural differences, the Gini coefficient has remained broadly stable in France and Italy since 2015, while it has declined by relatively similar magnitudes in Germany and Spain. Wealth inequality remains lower in the euro area than in the United States, despite a visible decline in inequality on the other side of the Atlantic since the start of the pandemic (see Box 1).
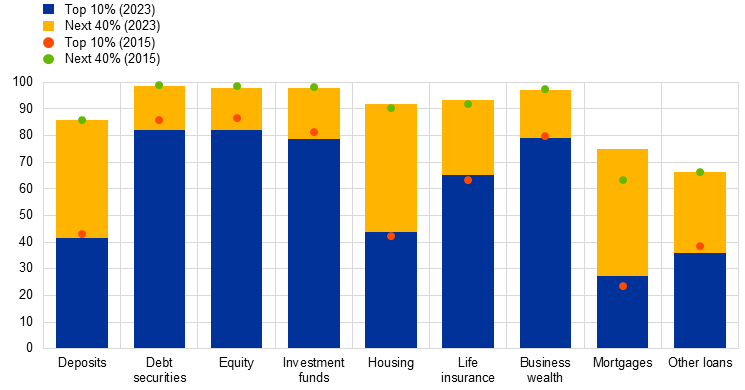
The concentration of wealth varies both across instruments and over time, reflecting differences in preferences, in access to various asset classes and in credit and liquidity constraints. Concentration is particularly high for financial assets exposed to changes in value: around 80% of equities, investment fund shares and bond holdings are held by the top 10% wealthiest households (Chart 2). Business wealth exhibits similarly high concentration. Deposit holdings, housing wealth and liabilities (mortgages and other types of loan) are more evenly spread. Since 2015 there has been an increase in the concentration of housing wealth and mortgage debt, meaning a faster pace of accumulation – including through valuation effects – among wealthier households than poorer households. Moreover, relative holdings of debt securities and equity increased for the next 40% of households with wealth above the median.
Chart 2
Instrument concentration
(percentages of total outstanding amounts of each instrument)
Sources: ECB (DWA) and ECB calculations.
Notes: The chart shows average instrument holdings by net wealth group as a share of the total corresponding instrument outstanding amounts for 2015 and 2023. The latest observations are for the fourth quarter of 2023.
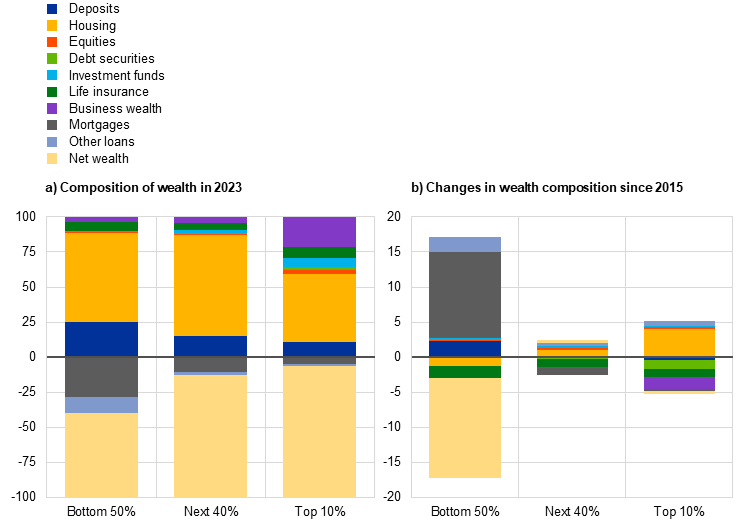
The composition of net wealth also varies across wealth groups and changes over time. The bottom 50% hold a greater proportion of their wealth in bank deposits and housing, at around 25% and 63% respectively. The next 40% hold a similar share of both instruments together, but with a relatively lower weight for deposits and higher weight for housing (15% and 72% respectively). The shares of deposits and housing are smaller for the top 10% wealthiest households (10% and 50% respectively), as this group holds a larger share of business wealth and financial wealth other than deposits (Chart 3, panel a). Moving up the wealth distribution, the share of deposits declines while net wealth and riskier assets (equities, investment funds and bonds) increase, as wealthy households are able to bear more risk. Furthermore, household indebtedness declines going up the wealth distribution, as assets (e.g. housing) become less leveraged. Over time, a decline in borrowing by the bottom half of the wealth distribution (Chart 3, panel b) has helped to strengthen their balance sheets and increase their net wealth share in total assets, which has served to reduce inequality.
Chart 3
Composition of net wealth distribution
(percentages of group-specific net wealth; percentage point changes)
Sources: ECB (DWA) and ECB calculations.
Notes: Net wealth is shown with a negative sign. The latest observations are for the fourth quarter of 2023.
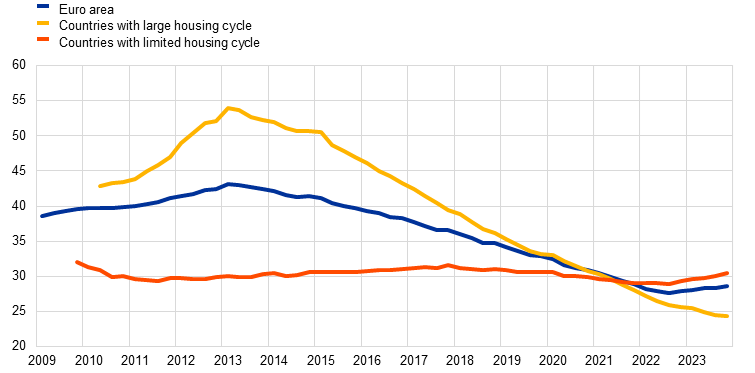
On the liabilities side, household leverage in the euro area has declined substantially for the bottom half of the wealth distribution over the past decade and has remained broadly unchanged for the top half. The deleveraging process over the past decade, supported mainly by the bottom half of the wealth distribution (Chart 4, panel a), was driven by an increase in assets alongside a decline in liabilities. Over recent years, with higher interest rates, deleveraging has continued, albeit at a slower pace, possibly indicating some use of household excess savings towards debt repayment or reduced borrowing. The reduction in leverage in the bottom half of the distribution has been driven mostly by economies which underwent strong housing market cycles, with significant price fluctuations and price corrections in the context of the global financial crisis and the euro area sovereign debt crisis (Chart 4, panel b). Nevertheless, leverage for the bottom 50% remains significantly higher than for wealthier households.
Chart 4
Leverage ratios across the wealth distribution in the euro area
a) Total debt-to-asset ratios across the wealth distribution
(percentages)

b) Mortgage debt-to-asset ratios for the bottom 50% of the wealth distribution
(percentages)
Sources: ECB (DWA) and ECB calculations.
Notes: The leverage ratio is total debt divided by total assets in panel a) and mortgage debt divided by total assets in panel b). In panel b), countries with a large housing cycle are those that experienced a significantly larger decline in house prices (greater than 2% on average per year over 2007-13) compared with the euro area as a whole (-0.35% on average per year over 2007-13), consistent with the assessment in the article entitled “The state of the housing market in the euro area”, Economic Bulletin, Issue 7, ECB, 2018. These countries include Spain, the Netherlands, Ireland, Portugal, Greece, Estonia, Lithuania and Latvia. The countries with a limited housing cycle comprise those with house price changes similar to or greater than the euro area average during the same period; these include Germany, France, Italy, Belgium, Finland, Slovakia, Slovenia and Luxembourg. The country aggregation is performed bottom-up by aggregating assets and liabilities for the bottom 50% of households by net wealth. The starting dates for the DWA differ across countries, consistent with the country-specific HFCS waves. The latest observations are for the fourth quarter of 2023.
Box 1
Distributional Financial Accounts in the United States
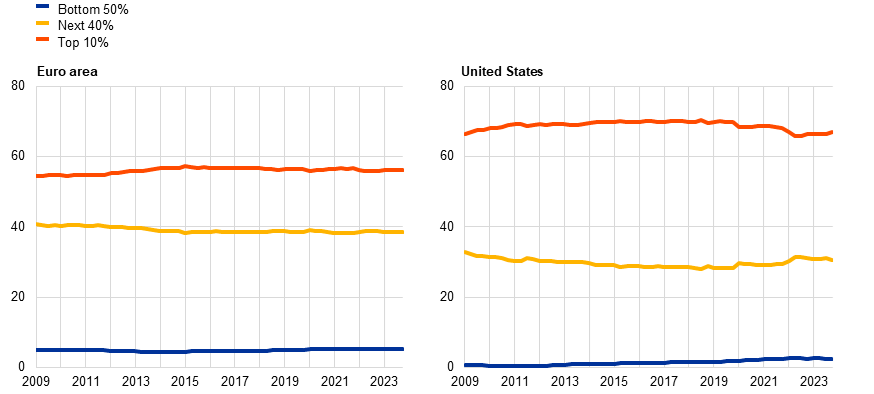
Similar to the Distributional Wealth Accounts (DWA) in the euro area, the US Federal Reserve System compiles the Distributional Financial Accounts (DFAs) for the United States. This dataset contains quarterly estimates of the distribution of US household wealth since 1989.[13] Despite declining visibly over the last few years, wealth inequality remains significantly higher in the United States than in the euro area, with the top decile of the wealth distribution in the United States holding around two-thirds of total net wealth (Chart A).[14]
Chart A
Concentration of net wealth in the euro area and the United States
(percentages)
Sources: ECB (DWA), US Federal Reserve Board and ECB calculations.
Notes: The chart shows the net wealth holdings by net wealth group as a share of the total. The latest observations are for the fourth quarter of 2023.
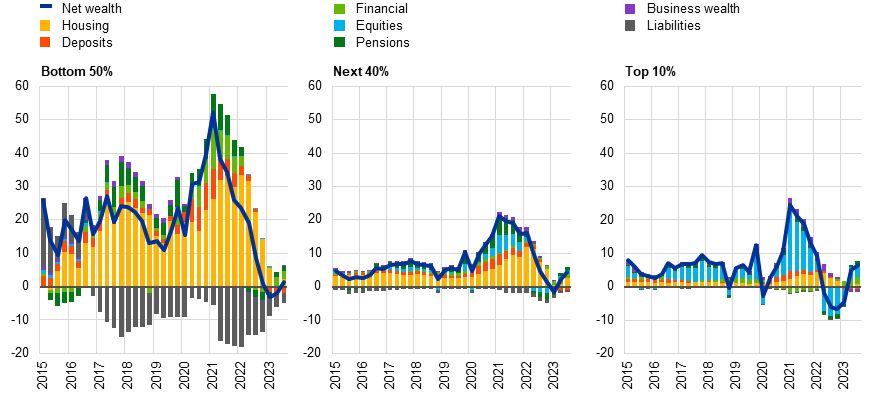
In the United States, the wealth at the top of the distribution is largely held in business and financial assets, such as corporate equities, mutual fund shares and pensions, and less in housing than in the euro area. The bottom 50% of the wealth distribution hold their assets mainly in housing and are more leveraged than euro area households, including through liabilities other than mortgages (Chart B). The higher level of wealth concentration in the United States reflects multiple factors such as the degree of labour income inequality and movements in house prices relative to financial asset prices compared with Europe.[15] Over the past two years, the bottom 50% of the wealth distribution have increased their wealth at a faster pace than the rest (around 6.9% average growth compared with 5% and 0.3% respectively for the next 40% and the top 10%), which has led to a more rapid decline in wealth inequality in the United States than in the euro area. This has mainly been driven by a faster accumulation of housing wealth by the bottom 50%, predominantly due to rising real estate prices and a lower accumulation of debt relative to the rest of the wealth distribution (Chart C). Nevertheless, financial wealth has also played a major role. The wealth of the top 10% declined following the start of the latest monetary policy tightening cycle in the United States in early 2022 driven primarily by equities and, to a lesser extent, pension holdings, which have only just started to increase again more recently (Chart C).[16]
Chart B
United States: composition of net wealth
(percentages of group-specific net wealth; percentage point changes)

Sources: US Federal Reserve Board and ECB calculations.
Note: The net wealth is shown with a negative sign.
Chart C
United States: net wealth growth and contributions
(annual percentage changes; percentage point contributions)
Sources: US Federal Reserve Board and ECB calculations.
Notes: Compared with the euro area, data for the United States include more instruments, such as currency, pension entitlements and consumer durables, with the latter included in housing wealth in Chart C above. Other financial wealth as depicted in the chart excludes deposits, equities and pensions. Business wealth includes equities in non-corporate businesses. The latest observations are for the fourth quarter of 2023.
4 Asset price fluctuations and the wealth distribution
Changes in asset prices affect household wealth differently across the wealth distribution, depending on the composition of wealth, with consequences for inequality. The impact of asset price changes on household wealth depends on the sensitivity of balance sheet instruments to market conditions and prevailing interest rates, and on households’ exposures to such instruments via their holdings of assets and liabilities. Developments in households’ holdings tend to be sluggish, as they do not rebalance strongly in response to asset price changes. Changes in household net wealth are primarily driven by gains and losses on holdings of real estate and equity which, in turn, follow house and stock prices very closely.
The effects of asset price changes on household balance sheets represent an important channel of monetary policy transmission. For instance, a decline in house prices, reflecting changing market conditions or monetary policy tightening, reduces the net wealth of existing homeowners and renders them poorer, as the value of their housing wealth falls while their liabilities remain the same. The associated negative wealth effects can prompt them to consume less and save more in order to rebuild their wealth.[17]
Household wealth for the bottom 50% tends to be markedly more sensitive to changes in house prices than the wealth of the top 10%. The bottom half of the distribution, with higher housing-to-net-wealth ratios and more leveraged housing exposures, are significantly more sensitive to changes in house prices than to changes in prices for other assets (Chart 5). A simple indicator of this sensitivity is a leverage multiplier which measures the exposure to a particular asset class in relation to wealth. This indicator allows the mechanical effects of a hypothetical 10% increase in the prices of various asset classes on household net wealth to be traced, and to see how these effects change over time, while abstracting from indirect channels associated, for instance, with portfolio reallocation.[18] A 10% house price appreciation increases the net wealth of households in the bottom 50% by more than 10%, on average. By contrast, the positive effect on wealth of such an increase amounts to around 5% for the top 10% wealthiest households, as they are less indebted and housing represents a smaller portion of their wealth. Housing exposures therefore tend to become smaller as wealth increases due to the effect of lower indebtedness in proportion to housing values (Chart 5, panel a).
At the same time, the effects of equity price changes are strongest at the top of the wealth distribution (Chart 5, panel b). This reflects the high concentration of this type of asset among the wealthy. Consequently, while rising house prices would tend, in isolation, to reduce inequality by disproportionately benefiting the less wealthy, the opposite effect is observed with rising equity prices.
Chart 5
Net wealth changes across the wealth distribution from a 10% rise in asset prices
a) Net wealth gains from a 10% rise in house prices
(percentages of net wealth)
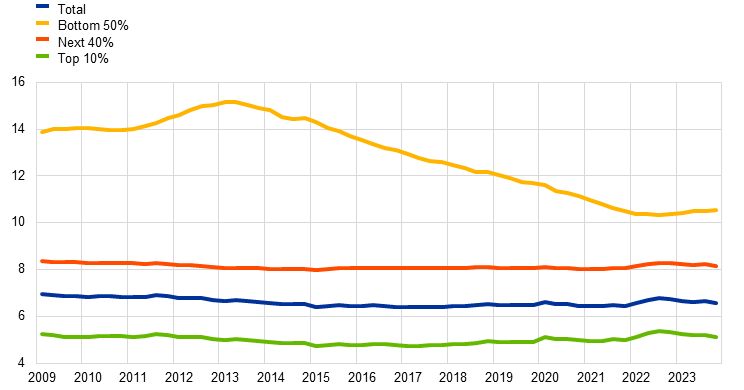
b) Net wealth gains from a 10% rise in equity prices
(percentages of net wealth)

Sources: ECB (DWA) and ECB calculations.
Notes: The sensitivity of wealth to a 10% rise in house prices and a 10% rise in equity prices is based on the ratio of housing wealth to net wealth and the ratio of equity asset holdings to net wealth respectively. Equity assets comprise direct and indirect exposures and are the sum of holdings of listed equity, financial business wealth and indirect equity holdings via household mutual fund shares and pension claims. The ratio of equities in household mutual fund shares is based on aggregate look-through statistics for household asset holdings held indirectly via investment fund shares. For pension claims, the ratio is computed as the share of equities in the total financial assets of insurance corporations and pension funds, including indirect equity exposures via their investment fund holdings, in the latter case using the same equity ratio in investment fund shares held by insurance corporations and pension funds as the share of equity exposures for investment fund shares of households based on look-through statistics. The latest observations are for the fourth quarter of 2023.
Nevertheless, the share of housing in net wealth has decreased over time as the less wealthy have consolidated their balance sheets. Deleveraging over the past decade has caused the share of housing in net wealth at the bottom of the wealth distribution to decline. This may have important implications for monetary policy transmission via asset prices in a context of rising policy rates, as less wealthy households may have become more resilient to housing market corrections compared with the global financial crisis and euro area sovereign debt crisis.
While homeowners in the bottom half of the distribution have benefited more from higher house prices, this wealth group refrained from house purchases as affordability worsened. Chart 6 shows that, considered in isolation, positive housing wealth revaluations (i.e. driven by higher house prices which gradually increased the market value of homes) from 2015 on have disproportionately benefited net wealth at the bottom half of the distribution.[19] Consequently, rising house prices have contributed to the observed decline in wealth inequality since 2015. At the same time, housing transactions have partly reversed that effect by working in the opposite direction as the bottom 50% reduced their housing assets while the rich accumulated more.[20] This may reflect the distributional consequences of rebalancing, as the rising house prices reduced home affordability for the less wealthy. This conclusion is supported by evidence of declining homeownership rates and correspondingly higher rental rates among the less wealthy over the past decade in countries such as Spain which have seen substantial housing adjustments.[21] The adjustment appears to have had a greater impact on younger cohorts that also reduced their indebtedness and homeownership during the crisis periods to levels closer to the euro area average.[22]
Chart 6
Cumulative effects of transactions and revaluations on net wealth across the wealth distribution
(cumulative percentage changes in net wealth since Q1 2009; percentage point contributions)

Sources: Eurostat, ECB (DWA, QSA) and ECB calculations.
Notes: Valuation effects by instrument are computed from the aggregate Quarterly Sectoral Accounts (QSA) by subtracting quarterly transactions from differences in outstanding amounts (OA) which include flows, changes in valuations and other changes. Housing revaluations are computed by subtracting housing investment flows (approximated by household gross fixed capital formation plus acquisition of non-financial assets net of consumption of fixed capital) from changes in the housing capital stock (approximated by household non-financial fixed assets including land). Business wealth revaluations are computed from a weighted average of the investment deflators for machinery and equipment and for commercial property prices. The QSA valuation changes by instrument are then applied proportionately (in terms of quarterly percentage changes) to the corresponding instrument holdings across each decile in the wealth distribution to decompose OA stocks into valuation effects (including other changes) and notional stocks (derived from the cumulation of transactions). Liabilities are assumed to result only from transactions. The latest observations are for the fourth quarter of 2023.
5 Impact of inflation and monetary policy on wealth distribution
The composition of assets and liabilities across the wealth distribution determines the extent to which high inflation affects wealth inequality. Unanticipated inflation may lead to a drop in wealth inequality by redistributing wealth from lenders to borrowers through changes in the real value of nominal assets and liabilities. This is known as the Fisher channel.[23] Nevertheless, the Fisher channel only works fully if income adjusts to inflation, thereby reducing the burden of payments from indebted households, which are usually those at the bottom of the wealth distribution. The Fisher channel is weakened when higher unexpected inflation reduces the real interest income of low and medium-income households and increases the profit income of high-income households.[24]
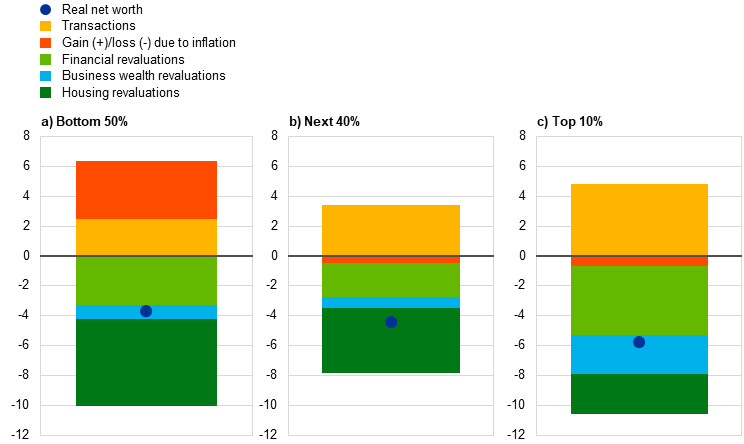
The effects of an inflation shock on the wealth distribution can be assessed by decomposing changes in real net wealth into contributions from transactions, real asset revaluations and erosion due to inflation.[25] The assessment quantifies the effect on real net wealth stemming from the nominal erosion of its components (which is negative for nominal assets and positive for nominal liabilities) over the high-inflation period since mid-2021 across the wealth distribution. It does so by reproducing the ex-post decomposition in the cumulative change in net wealth between two points in time − end-of-sample (fourth quarter of 2023) − relative to the surge in inflation starting in the second quarter of 2021 − into three components: the transactions component, the developments in real asset prices and the erosion (due to inflation) component. The first and second components are similar to those shown in Chart 6; they trace the effects of savings and revaluations on wealth accumulation (albeit in real terms). The third component quantifies the erosion by inflation of the real value of assets and liabilities, with reimbursements set in advance in nominal terms (deposits and debt).
Real net wealth has declined across the wealth distribution since mid-2021, but higher inflation has tempered losses for poorer households by eroding their liabilities more than their deposits, while also amplifying losses for wealthier households (Chart 7). The effect reflects distributional differences in net nominal positions in assets and liabilities whose reimbursement value is set in nominal terms, in addition to the heterogeneity in net savings which are captured by the transaction component. Poorer households, as a group, hold lower deposits than debt. This implies that inflation will erode a higher share of their liabilities than their assets exposed to inflation (i.e. deposits), while the opposite occurs for wealthier households. This effect captures only the wealth redistribution from savers to borrowers, working mechanically through balance sheet positions, and ignores other effects such as flows of interest income and debt repayments, as well as differences within wealth groups given that only a given share of households holds any debt.[26] Going up in the wealth distribution, real wealth losses have increased over the last two and a half years, despite stronger contributions to net wealth from savings and less limited losses from falling real house prices. This result is mostly attributable to revaluations of financial assets other than deposits (such as shares and bonds) and business wealth, which have experienced larger real losses amid rising interest rates.
Chart 7
Changes in real net wealth since Q2 2021 and contributions
(cumulative percentage changes; percentage point contributions)
Sources: Eurostat, ECB (DWA, QSA) and ECB calculations.
Notes: The decomposition is based on Infante, L. et al., op. cit. Net worth is deflated with the private consumption deflator. Instruments highly exposed to inflation (whose reimbursement value is set in advance in nominal terms) include deposits and liabilities (mortgages and other debt). The net effect from the impact of higher inflation on deposits (negative) and on liabilities (positive) is aggregated under “Gain(+)/loss(-) due to inflation”. For all other assets, revaluations are based on the contributions from cumulative real asset price changes applied at individual instrument class level, derived on the basis of nominal revaluations by instrument taken from the aggregate QSA deflated with the private consumption deflator, and applied to outstanding instrument positions by wealth decile as of the second quarter of 2021. The real asset price revaluation effects are grouped under “Financial revaluations” for all financial assets other than deposits (i.e. listed shares, investment funds, bonds and insurance claims). “Business wealth revaluations” is the sum of financial and non-financial business wealth. Transactions are computed as a residual and group acquisitions of any instruments over the period.
Turning to the effects of monetary policy, changes in the wealth distribution across households can occur mainly through two channels. The first channel involves asset prices, as the size and compositions of holdings in the euro area imply that some households hold more long-term assets and are, therefore, more affected by (asset) price movements related to the monetary policy stance, as also documented in Section 4.[27] The second channel relates to savings remuneration and the cost of debt, as a shift in interest rates will have contrasting effects on the wealth of net borrowers as opposed to net savers. While there is some agreement on the effects of monetary policy on the income distribution, the distributional impacts on wealth are less clear and the findings are rather mixed. In this sense, some of the available analyses suggest overall limited effects on the wealth distribution, while other studies indicate increasing wealth inequality due to expansionary unconventional monetary policy.[28] [29]
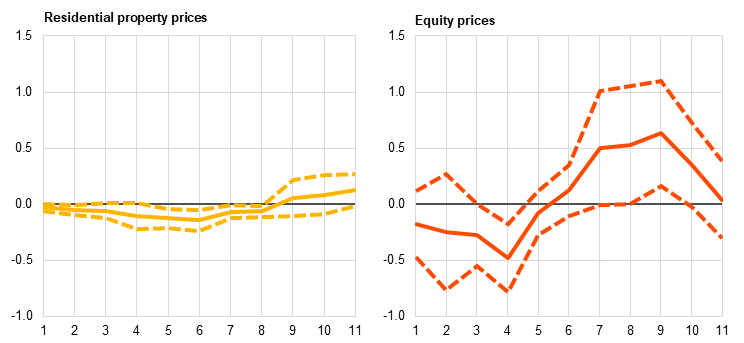
Empirical evidence points to dampening effects of monetary policy tightening across the wealth distribution. Changes in asset prices have a direct impact on household balance sheets.[30] Following the start of monetary policy tightening, equity prices initially declined in the first three quarters of 2022 but subsequently rebounded strongly. In contrast, house prices, which usually exhibit lower volatility, only began declining more visibly later in response to higher interest rates, although the total decline remained modest for the euro area as a whole amidst heterogeneous developments across countries. A linear panel local projections framework is used to assess the impact of monetary policy tightening on the wealth distribution, with a focus on the housing and financial wealth channels.[31] Empirical estimates point to a dampening effect of monetary policy tightening which is heterogenous across the wealth distribution.[32] Overall, all household groups lose in terms of their net wealth (Chart 8, panel a). While the bottom 50% lose mainly via housing wealth due to lower house prices, the next 40%, and especially the top 10%, lose primarily via financial wealth channels, with the housing channel playing a more limited role. Nevertheless, for the latter group, net wealth tends to recover quicker in line with equity prices rebounding faster than house prices (Chart 8, panel b), despite a relatively larger initial fall following the monetary policy shock. Overall, the monetary policy tightening seems to have a dampening effect across the wealth distribution, with the housing channel playing a relatively stronger role for the less wealthy, while the financial channels seem more important for the wealthiest households.[33]
Chart 8
Effects of monetary policy
a) Impact on net wealth of monetary policy tightening
(percentages)
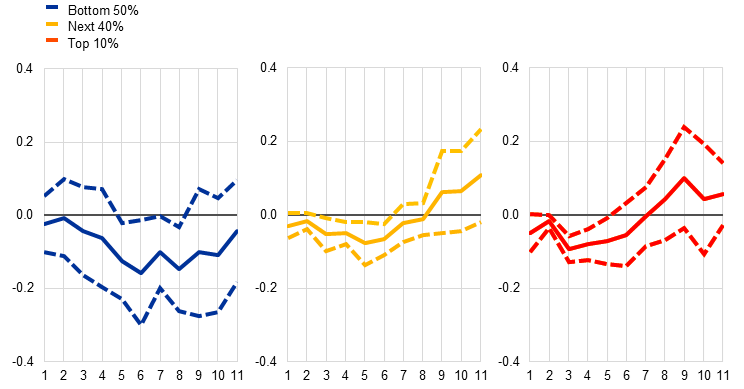
b) Impact on net wealth of monetary policy tightening
(percentages)
Sources: ECB (DWA), Eurostat and ECB calculations.
Notes: Panel a) shows the results based on a panel local projections model for the five largest euro area countries (Germany, France Italy, Spain and the Netherlands) with an (unbalanced) sample, running from the fourth quarter of 2009 to the fourth quarter of 2023 and accounting for country-fixed effects. The model includes as dependent variables the net wealth for the three relevant groups of the wealth distribution − bottom 50%, next 40% and top 10% − and the monetary policy shocks corresponding to monetary policy surprises, as reflected in changes in one-year overnight index swap risk-free rates around the ECB’s monetary policy announcements, as identified in Altavilla, C. et al. (2019) as an exogenous variable.[34] Following Lenza, M. and Slacalek, J., op. cit., asset (real estate and equity) prices have been added to the model alongside real GDP, short-term rate and inflation. Panel b) shows the results based on a panel local projections model, including as dependent variables asset prices. The model includes four lags of the dependent variables as well as lags of the control variables. The dashed lines reflect the 95% confidence intervals. The results for wealth-specific instruments for the three groups of the wealth distribution are consistent with the findings in Chart 8, panel a), showing that housing wealth declines in relative terms slightly more for the bottom 50%, while financial wealth more for the top 10%.
6 Conclusions
This article introduces the newly available DWA, providing evidence on heterogeneity in the wealth levels of households. Wealth concentration in the euro area declined between 2015 and 2023, as the wealth of the 50% less wealthy households rebounded faster than for the top 10%, albeit from relatively lower levels. Wealth accumulation for the bottom half was supported by relatively faster increases in the value of financial and housing assets and by household deleveraging that reduced debt burdens and strengthened balance sheets. Wealth inequality in the euro area remains significantly lower than in the United States. Higher house prices may have reduced inequality in the euro area as a whole since 2015 by, in relative terms, predominantly benefiting the bottom half of the wealth distribution, amidst cross-country heterogeneity. This has more than offset the impact from housing transactions, which likely had the opposite effect, as the bottom 50% have reduced their housing assets while the wealthy have accumulated more.
This article also makes use of the DWA to assess the impact of the recent surge in inflation and subsequent monetary policy tightening on the distribution of wealth. The analysis finds that, in relative terms, poorer households’ balance sheets have been affected less by the recent surge in inflation. This is because, in real terms, their liabilities have been eroded more, given the balance between outstanding deposits and debt. At the same time, wealthier households have been affected more by the amplified losses in real net wealth due to revaluations of financial asset prices in real terms, as nominal valuation changes for different financial asset classes have not kept up with inflation. Both groups are assessed to have most likely experienced nominal net wealth losses as a result of monetary policy tightening. While the bottom 50% are likely to have experienced losses in housing wealth due to lower house prices in the euro area as a whole, for the next 40%, and especially the top 10%, such losses are likely to have occurred primarily through financial wealth channels, with housing playing a more limited role.
In parallel with the DWA in Europe, similar datasets are currently being developed as part of the third phase of the G20 Data Gaps Initiative, with a view to distributional accounts being compiled for the G20 and other participating economies by 2026.
See, for instance, the boxes entitled “The recent drivers of household savings across the wealth distribution”, Economic Bulletin, Issue 3, ECB, 2022, and “The consumption impulse from pandemic savings ‒ does the composition matter?”, Economic Bulletin, Issue 4, ECB, 2023.
See the overview of the ECB’s monetary policy strategy on the ECB’s website.
See Ampudia, M., Georgarakos, D., Slacalek, J., Tristani, O., Vermeulen, P. and Violante, G., “Monetary policy and household inequality”, Working Paper Series, No 2170, ECB, July 2018.
The HFCS collects detailed household-level data on various aspects of household balance sheets and related economic and demographic variables. For further information, including on the definition of households, see the HFCS page on the ECB’s website.
Not reflected in household wealth, as measured by the national accounts and therefore also not in the DWA, are the expected pensions paid by social security systems.
The DWA euro area data are computed by merging the DWA household-level data computed for each country, adjusted to fit with the actual QSA euro area aggregates via proportional allocation and by recalculating the net wealth deciles at the euro area level incorporating all euro area households.
Additional information can be found in the Overview note, Methodological note and Press release on the ECB’s website.
Net wealth is defined as the difference between total assets (financial and non-financial) and total liabilities. For some households, it could be zero or negative.
A Gini coefficient of 0 expresses perfect equality where everyone has the same wealth, while a coefficient of 1 expresses full inequality where only one person has all the wealth.
For a discussion of the factors driving dispersion in wealth inequality across euro area countries, see Leitner, S., “Drivers of wealth inequality in euro area countries: the effect of inheritance and gifts on household gross and net wealth distribution analysed by applying the Shapley value approach to decomposition”, European Journal of Economics and Economic Policies: Intervention, Vol. 13, Issue 1, 2016, pp. 114-136.
See Kaas, L., Kocharkov, G. and Preugschat, E., “Wealth inequality and homeownership in Europe”, Annals of Economics and Statistics, No 136, 2019, pp. 27-54.
For more information, see “Distributional Financial Accounts Overview”, Board of Governors of the Federal Reserve System, March 2024.
For a detailed comparison of wealth, income and consumption inequality across advanced economies, see the article entitled “Monetary policy and inequality”, Economic Bulletin, Issue 2, ECB, 2021.
See Blanchet, T. and Martinez-Toledano, C., “Wealth inequality dynamics in Europe and the United States: Understanding the determinants”, Journal of Monetary Economics, Vol. 133(C), 2023, pp. 25-43.
For a discussion about the drivers of wealth inequality in the United States, see Fagereng, A., Guiso, L., Malacrino, D. and Pistaferri, L., “Heterogeneity and Persistence in Returns to Wealth”, Working Paper Series, No 171, IMF, 2018.
For an overview of estimates of wealth effects in the euro area, see the box entitled “Estimates of wealth effects for the euro area and the largest euro area countries” in the article entitled “Household wealth and consumption in the euro area”, Economic Bulletin, Issue 1, ECB, 2020.
For a detailed explanation, see Adam, K. and Tzamourani, P., “Distributional consequences of asset price inflation in the Euro Area”, European Economic Review, Vol. 89, 2016, pp. 172-192.
This is consistent with the findings in Adam, K. and Tzamourani, P., op. cit.
Declining leverage for the bottom 50% is consistent with the declining participation in the housing market, most likely due to low affordability in the context of rising house prices and, more recently, higher interest rates and tighter credit constraints.
See “Recent developments in the rental housing market in Spain”, Economic Bulletin, Issue 3, Banco de España, 2019.
This normalisation partly reflects strengthened macroprudential regulations and tighter credit provisions.
See Fisher, I., “The Debt-Deflation Theory of Great Depressions”, Econometrica, Vol. 1, No 4, 1933, pp. 337-357.
For further discussion on the strength of the Fisher channel in the context of rising inflation, see Erosa, A., and Ventura G., “On inflation as a regressive consumption tax”, Journal of Monetary Economics, Vol 49, Issue 4, May 2002, pp 761-795 and in Heer, B. and Süssmuth, B., “Effects of inflation on wealth distribution: Do stock market participation fees and capital income taxation matter?”, Journal of Economic Dynamics and Control, Vol. 31, Issue 1, January 2007, pp. 277-303.
The approach is based on equation 1 in Infante, L., Loschiavo, D., Neri, A., Spuri, M. and Vercelli, F., “The heterogeneous impact of inflation across the joint distribution of household income and wealth”, Occasional Paper Series, No 817, Banca d’Italia, November 2023.
For instance, the benefits from higher inflation accruing to less wealthy households because of their higher liabilities relative to deposits might be neutralised by their higher unhedged interest rate exposure. This makes them more susceptible to losses from deteriorating net interest income, relatively to wealthier households, as monetary policy reacts by raising interest rates in response to high inflation. Such effects are likely to depend on the prevalence of adjustable rate mortgages and vary greatly across countries. See Tzamourani, P., “The interest rate exposure of euro area households”, European Economic Review, Vol. 132, February 2021. In addition to affecting net interest income, higher interest rates would also limit the erosion of wealth by reducing inflation. A further caveat is that the analysis does not account for the possibility of group-specific inflation rates across the wealth distribution.
See also O’Farrell, R., Rawdanowicz, L. and Inaba, K., “Monetary Policy and Inequality”, OECD Economics Department Working Papers, No 1281, OECD Publishing, March 2016.
For studies pointing to limited effects of unconventional monetary policy easing on wealth inequality in the euro area, see Lenza, M. and Slacalek, J., “How does monetary policy affect income and wealth inequality? Evidence from quantitative easing in the euro area”, Journal of Applied Econometrics, April 2024; for an analysis of Italian household wealth, see Casiraghi, M., Gaiotti, E., Rodano, L. and Secchi, A., “A ‘reverse Robin Hood?’ The distributional implications of non-standard monetary policy for Italian households”, Journal of International Money and Finance, Vol. 85, 2018, pp. 215-235; for an analysis on US, see Greenwald, D.L., Leombroni, M., Lustig, H. and Van Nieuwerburgh, S., “Financial and total wealth inequality with declining interest rate”, NBER Working Paper, No 28613, 2021; for evidence pointing to increasing wealth inequality in the euro area following unconventional monetary policy expansion, see De Luigi C., Feldkircher, M., Poyntner P., Schuberth, H, “Quantitative easing and wealth inequality: the assets price channel”, Oxford Bulletin of Economics and Statistics, Vol. 85, Issue 3, February 2023, pp 638-670.
For a discussion of the distributional effects of monetary policy on wealth, see also “The distributional footprint of monetary policy”, BIS Annual Economic Report, Bank for International Settlements, June 2021.
The impact on capital gains/losses from lower/higher interest rates depends on whether assets have longer durations than liabilities; see the articles entitled “Monetary policy and inequality”, Economic Bulletin, Issue 2, ECB, 2021, and “The impact of the recent inflation surge across households”, Economic Bulletin, Issue 3, ECB, 2023.
The local projections models follow the approach pioneered in Jordà, O., “Estimation and Inference of Impulse Responses by Local Projections”, American Economic Review, Vol. 95, No 1, March 2005, pp. 161-182.
As the present analysis focuses on specific wealth groups as reported by DWA, assessing the overall implications of the results for wealth inequality is not straightforward. Available results from the literature suggest that findings can be sensitive to the employed measures of inequality (see De Luigi et al. (2023) op. cit).
There are some caveats due to the limited DWA sample and the partial analysis of this assessment which abstracts from other potentially important general equilibrium channels at play.
See Altavilla, C., Brugnolini, L., Gürkaynak, R.S., Motto R., Ragusa, G., “Measuring euro area monetary policy”, Working Paper Series, No 2281, ECB, May 2019. The results are robust to using the longer-term maturities of different policy instruments, as in Altavilla, C. et al. (2019), or other monetary policy shocks such as those identified in Jarociński, M. and Karadi, P., “Deconstructing Monetary Policy Surprises – The Role of Information Shocks”, American Economic Journal: Macroeconomics, Vol. 12, No 2, April 2020, pp. 1-43.


